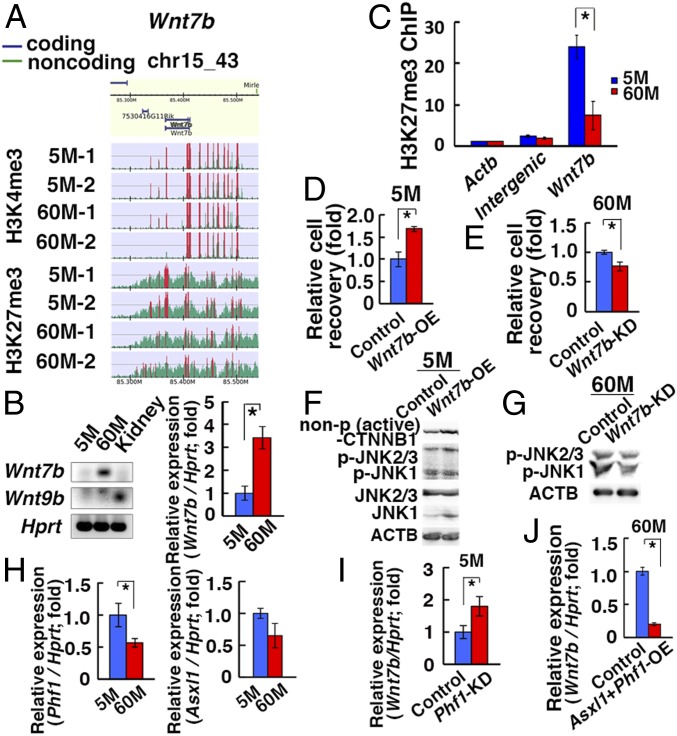
Fig. 4.
Induction of Wnt7b after long-term culture. (A) ChIP-Seq analyses of the Wnt7b promoter region. The green histogram indicates the ChIP-read line, and the region above the threshold is highlighted in red. The red regions in ChIP-read line indicate peak regions. (B) RT- and real-time PCR analyses of Wnt7b and Wnt9b (n = 5–9). (C) ChIP analyses of the Wnt7b promoter region. (D) Enhanced cell recovery of 5M-GS cells 7 d after Wnt7b OE (n = 3). (E) Reduced cell recovery of 60M-GS cells 7 d after Wnt7b KD (n = 3). (F) Western blot analyses of 5M-GS cells 7 d after Wnt7b OE. (G) Western blot analyses of 60M-GS cells 4 d after Wnt7b KD. (H) Real-time PCR analyses of Phf1 and Asxl1 (n = 8, for Phf1; n = 4, for Asxl1). (I) Real-time PCR analyses of Wnt7b 3 d after Phf1 KD in 5M-GS cells (n = 8). (J) Real-time PCR analyses of Wnt7b 3 d after cotransfection of Phf1 and Asxl1 in 60M-GS cells (n = 8). Asterisks indicate statistical difference.

