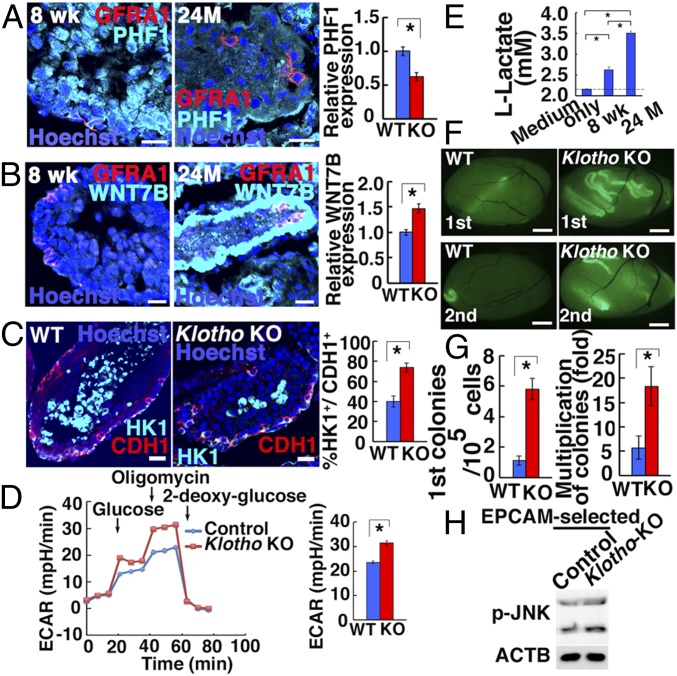
Fig. 5.
Functional analyses of SSCs in Klotho KO mice and BN rats. (A and B) Immunostaining of BN rat testes by GFRA1 and PHF1 (A: n = 22) or WNT7B (B: n = 20–21). (C) Immunostaining of Klotho KO mouse testes by HK1 and CDH1 (n = 25 to 29). (D) ECAR of Klotho KO spermatogonia (n = 21 to 22). (E) Lactate production of BN rat spermatogonia (n = 6). (F) Appearance of primary (Top) and secondary (Bottom) recipient testes. (G) Colony counts (n = 16, for first recipients; n = 12, for second recipients). (H) Western blot analyses of phosphorylated JNK in EPCAM-selected Klotho KO testis cells (n = 7). (Scale bars: A–C, 20 μm; F, 1 mm.) Asterisks indicate statistical difference.

