Fig. 1.
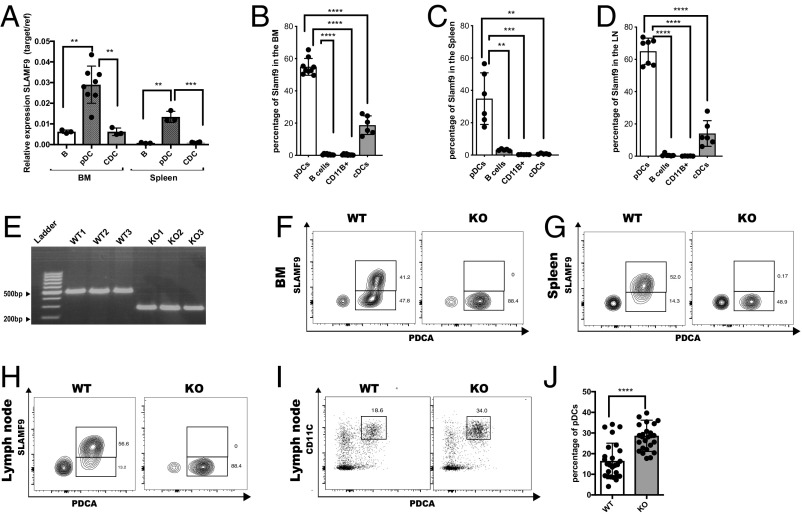
SLAMF9 is expressed on pDCs and regulates their numbers. (A) Sorted pDCs (CD19−CD11CinterB220+PDCA+), B cells (CD19+ B220+), and cDCs (CD19−B220−CD11B+CD11Chigh) were analyzed for the mRNA levels of SLAMF9. Graph shows relative expression of target gene/reference gene (L32). Results are represented as mean percentage ± SD (unpaired t test 2-tailed **P < 0.005, ***P < 0.0005); n = 3–8. (B–D) SLAMF9 protein levels were analyzed under naïve state in pDCs (CD19−CD11CinterB220+PDCA+ CD11B−), B cells (CD19+ B220+), cDCs (CD19−B220−CD11B+CD11Chigh), and in macrophages (CD11B+CD11C− CD19-SSClow). Graph shows protein levels in the BM (B), spleen (C), and in the LN (D). (E) DNA agarose gel electrophoresis demonstrating a genomic deletion of about 200 bp in 3 SLAMF9−/− mice compared with 3 WT controls. (F–H) Representative FACS plots showing SLAMF9 expression in WT compared with SLAMF9−/− pDCs as a negative control. (F) SLAMF9 expression in the BM. (G) SLAMF9 expression in the spleen. (H) SLAMF9 expression in the LN. (I and J) LN pDCs (CD19−CD11CinterB220+PDCA+) were analyzed in WT and SLAMF9−/− mice. (I) Representative dot plot. (J) Graph shows the percent of pDCs in the LN. Results are a summary of 6 independent experiment; n = 26 mice (unpaired t test 2-tailed *P < 0.05, **P < 0.005, ***P < 0.0005, ****P < 0.0001).

