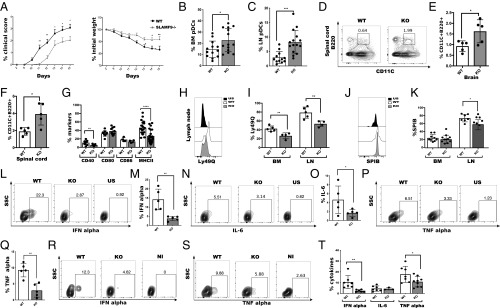
Fig. 5.
SLAMF9-deficient pDCs accumulate in the LN and CNS in vivo and are functionally impaired. EAE was induced in C57BL/6 mice WT and SLAMF9−/− mice by subcutaneous injection of MOG33–55 peptide in CFA and were further injected intraperitoneally with Pertussis toxin on days 0 and 2. EAE progression was monitored and assessed by standardized scoring until the peak of the disease on day 16. (A) Clinical scoring of EAE and weight measurements. Results are representative of 3 independent experiments; n = 11–15 mice. Data were analyzed using 2-way ANOVA for repeated measures, ***P = 0.0004, **P = 0.0013. (B and C) Graphical view of pDC percent in the BM and in the LN on day 16 after EAE. *P = 0.0272, ***P = 0.0004. (D) Representative staining profile of pDCs (CD45+CD11Cinter+, B220+CD11B) in the spinal cord. (E and F) Graphical view of pDCs in the spinal cord (E) and in the CNS (F). Results are representative of 2 independent experiments; each dot represent 2 mice; *P < 0.0308. (G) Graph summarizing the percent of CD40, CD80, CD86, and MHC class II on LN pDCs. Results are representative of 3 independent experiments; n = 9 to 15; **P = 0.0097, ****P < 0.0001. (H and I) Representative histogram of Ly49Q expression on LN pDCs from WT and SLAMF9−/− mice compared with FMO control (H). Graph shows the percent of Ly49Q on BM and LN pDCs from WT or SLAMF9−/− mice (I); n = 4 to 5 mice; **P < 0.005. (J and K) pDCs from the LN were isolated from EAE induced mice and analyzed for the expression of SpiB. Representative histogram of SpiB expression in LN pDCs from WT and SLAMF9−/− mice (J). Graph summarizing the percent of SpiB levels in BM and in LN pDCs (K). Results are a summary of 2 independent experiments; n = 7 to 10 mice; *P = 0.0101. (L–Q) Total LN cells were isolated from WT and SLAMF9−/− on day 16 following EAE induction, and stimulated for 5 h with 1 μM of ODN1585. (L and M) Representative staining and graphical view of IFN-α levels in WT and SLAMF9−/− pDCs compared with unstimulated control. (N and O) Representative staining and graphical view of IL-6 levels in WT and SLAMF9−/− compared with unstimulated control. (P and Q) Representative staining and graphical view of TNF-α levels in WT and SLAMF9−/− compared with unstimulated control. *P = 0.0173 and **P < 0.005. (R–T) WT and SLAMF9−/− mice were injected intravenously with 6 μg of CpG. After 24 h, LN cells were isolated and cultured for 5 h with 1 μM of ODN1585. Representative staining of IFN-α (R) and TNF-α (S), and graph view of cytokines levels (T) in WT and SLAMF9−/− pDCs compared with noninjected control. *P = 0.0395, **P = 0.0081.

