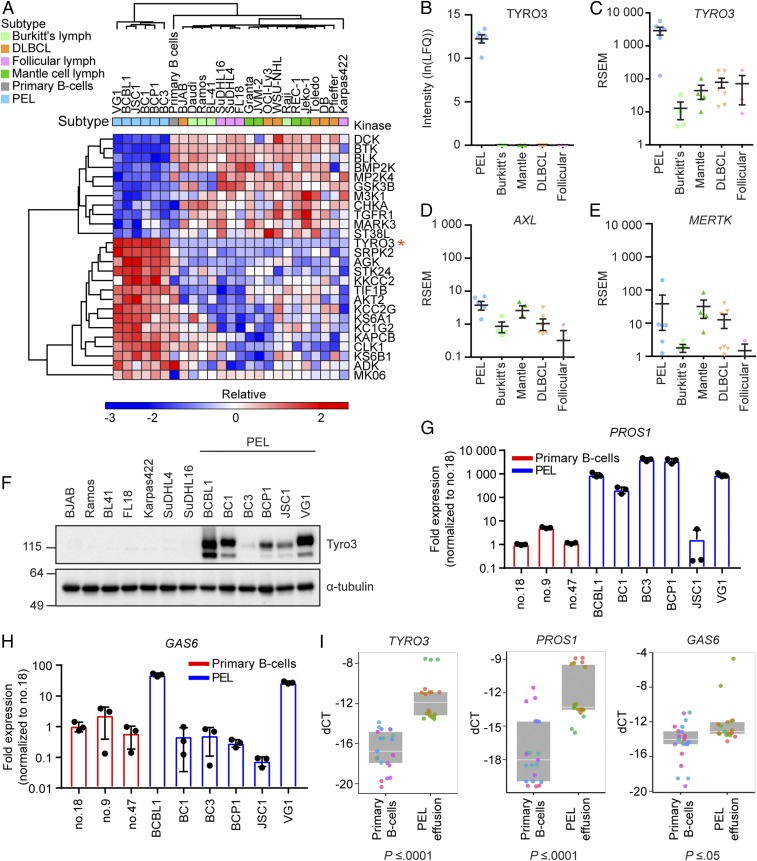
Fig. 3.
Tyro3 is uniquely up-regulated in PEL. (A) Euclidian hierarchical clustering of kinases having statistically higher or lower MIB binding in PEL compared with all other samples combined. Data presented are the average of 2 biological replicate MIB/MS runs for each cell line and an average of 5 replicate MIB/MS runs for primary B cells. Orange asterisk (*) indicates the row containing Tyro3. Refer to Dataset S2 for official gene names of the kinases. (B) Tyro3 MIB-binding levels in each individual subtype. Each point represents 1 cell line. Data presented are the mean ± SEM. (C–E) mRNA expression of (C) TYRO3, (D) AXL, or (E) MERTK from RNA-seq in each individual subtype. Each point represents 1 cell line. Data presented are the mean ± SEM. (F) Western blot analysis of Tyro3 protein levels from different NHL subtypes. Representative of n = 3 independent experiments. (G and H) qRT-PCR analysis of (G) PROS1 or (H) GAS6 mRNA from PEL cell lines or primary B cells isolated from 3 different donors. Graph is representative of n = 3 independent experiments with different primary B cell donors used for each experiment. Bar graph represents the mean ± SD (n = 3). (I) qRT-PCR analysis of TYRO3, PROS1, or GAS6 from primary B cells isolated from healthy donors (n = 7) or effusion from patients with PEL (n = 6). Replicates are shown as the same color for each primary B cell donor or PEL effusion sample. Data points are presented as the delta CT value between the gene of interest and actin for each individual replicate. Box plot represents the median with the 25th and 75th percentiles, respectively (ANOVA, P value listed below each graph). Lymph indicates lymphoma and LFQ indicates label-free quantification.

