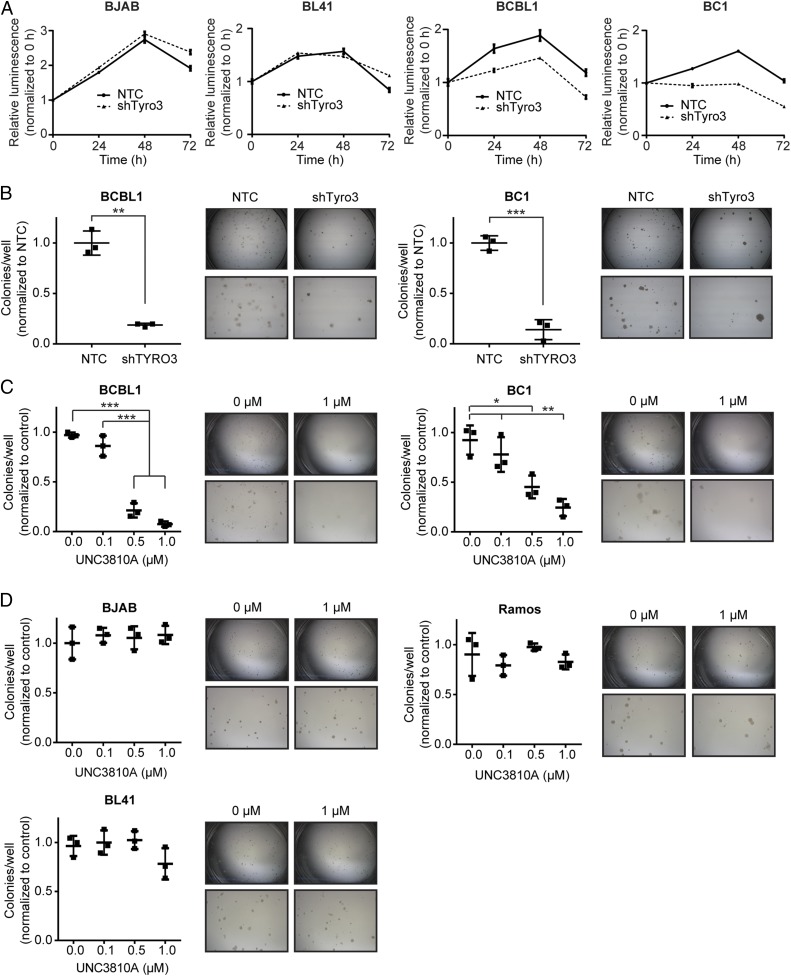
Fig. 5.
Inhibition of Tyro3 results in a decrease of cell survival and colony formation in PEL. (A) Cell-Titer Glo analysis of non-PEL NHL or PEL cell lines stably knocked down with nontemplate control or Tyro3 shRNA over a time course of 72 h in serum-starved conditions. Luminescence was normalized to the reading at 0 h for each condition. (B) PEL cells were assessed for colony formation after being knocked down with nontemplate control or Tyro3 shRNA in a lentivirus-mediated manner. (C and D) Colony formation of (C) PEL (BCBL1 and BC1) or (D) non-PEL NHL (BJAB, Ramos, or BL41) cells was assessed over increasing concentrations of UNC3810A. Saline was used as the vehicle control. (B–D) Representative microscope pictures are shown capturing the full diameter of the tissue culture plate (lengthwise) and also an area enlarged at the middle. The diameter of each plate is 35 mm in length. Significance is calculated using a one-way ANOVA test (*P < 0.05, **P < 0.01, ***P < 0.001, degrees of freedom = 8). Pictures were taken with a Leica MZ6 light microscope attached with a Leica MC170 HD camera. (A–D) All quantitative data are presented as mean ± SD (n = 3 independent samples) and all experiments are representative of n = 3 independent experiments.

