Fig. 7.
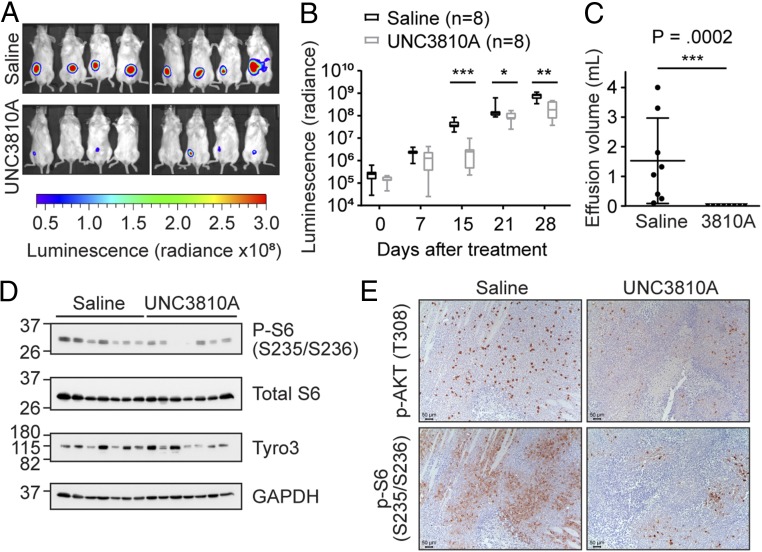
UNC3810A retards PEL tumor growth in vivo. NOD-SCID mice in a BCBL1-PEL xenograft model were i.p. injected with 0.9% saline (control) or 25 mg/kg UNC3810A 3 times a week—Monday, Wednesday, and Friday (MWF) over a course of 4 wk (n = 8 mice per group). Luciferase expression in saline or UNC3810A-treated mice was measured weekly by i.p. injecting mice with luciferin. (A) Luminescence images representing tumor burden taken at a 1-min exposure at 15 d after start of treatment. Luminescence images depict photon emission from tissue and are expressed as radiance (photons/second/centimeter squared/steradian). (B) Luminescence images were quantified using Living Image v4.4 to measure photon emission from tissue and are expressed as radiance (photons/second/centimeter squared/steradian). Data are presented as a box and whiskers plot with the whiskers marking the minimum and maximum values. The lowest, middle, and top lines of the box, respectively, represent the 25th percentile, median, and 75th percentile. (C) Effusions collected from mice treated with saline or UNC3810A were measured at the end of the study. Data represent mean ± SD (n = 8 mice per group). (D) Western blot analysis of solid tumors from mice treated with saline or UNC3810A (n = 7 per group). (E) Representative pictures of immunohistochemistry (IHC) stains against p-AKT (Thr308) and p-S6 (Ser235/Ser236) of mice treated with saline or UNC3810A. Sections were developed with DAB (3,3′-diaminobenzidine) and counterstained with hematoxylin. (Scale bars, 50 μm.) Slides were imaged using a Leica microscope (DMLS) and camera (DMC2900), and acquired using the Leica Application Suite v4.8 software. For B and C a 2-tailed unpaired Mann–Whitney U test was used to determine significance (*P < 0.05, **P < 0.01, ***P < 0.001).

