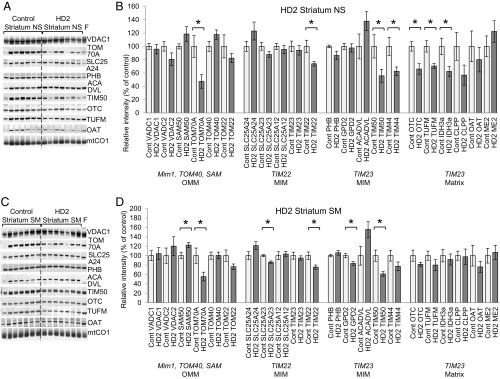
Fig. 4.
Mitochondrial protein levels are dysregulated in the striatum of HD2 patients. Immunoblots and quantification of mitochondrial proteins in nonsynaptosomal (NS; A and B) and synaptosomal (SM; C and D) mitochondria. Samples prepared from the striatum of non-HD patients were used as a control, and mitochondrial lysates from fresh (F) surgically resected cortex tissue of non-HD patients were included. Each lane represents the mitochondrial fraction from an independent tissue block. Mim1, TOM40, SAM, TIM22, and TIM23 represent import pathway of mitochondrial proteins. The immunoblot images for additional analyzed proteins are shown in SI Appendix, Fig. S5. For quantification, the intensity of each nuclearly encoded protein band was normalized to mtCO1 level in the same sample and normalized to the average control sample band intensity. The normalized values in control samples were taken as 100% and used to recalculate values for HD2 samples (n = 7, data shown as mean ± SEM). *P < 0.05 (t test); **P < 0.001 (t test).

