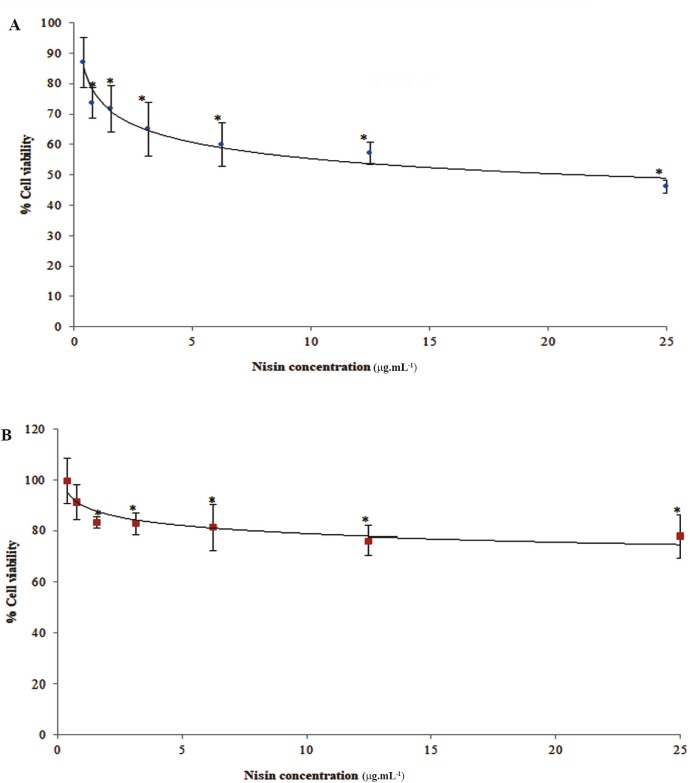
Figure 3.
The effects of nisin on cell viability as determined by MTT assay. A) MCF-7 and B) HUVEC. Cells were incubated for 48 h with different concentrations (0.39–25 μg.mL-1) of nisin. The vertical bars indicate the standard deviations (n = 4). Asterisks indicate the means, which were significantly different (p < 0.05) from the control (untreated cells).

