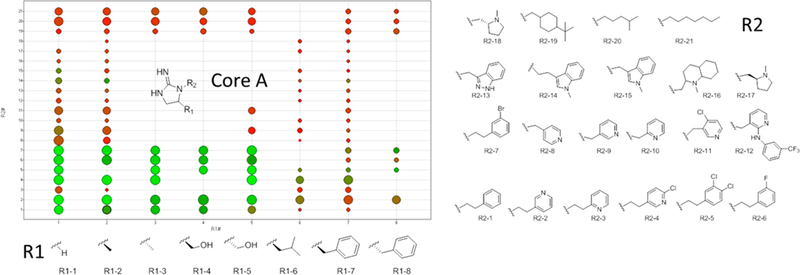
Figure 2.

SAR of different analogs with core A utilizing the different R group functionalities shown. The compounds were tested for ability to inhibit [3H]epibatidine binding at a single concentration (10 μM) at both α4β2 and α3β4 nAChR. Each dot represents a compound tested. The dots are color coded by α3β4 affinity [using a color gradient: red (0%, no binding) to green (100%, binding affinity)] and sized by α4β2 affinity (larger is higher affinity). A larger green dot binds to both targets at 10 μM, a large red dot indicates binding only to α4β2 at 10 μM, and a small green dot indicates binding only to α3β4 at 10 μM.
