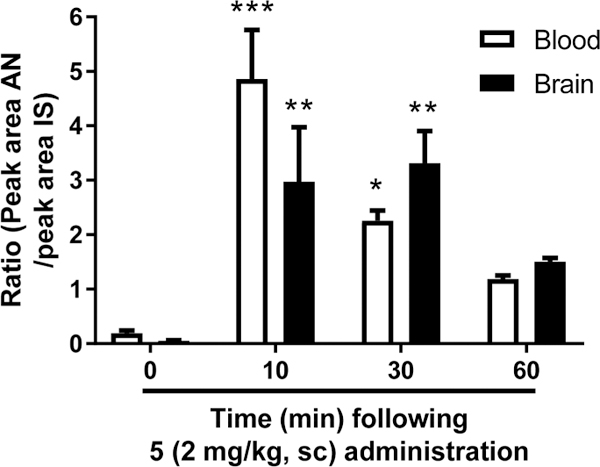
Figure 7.

Detection of 5 in rat blood and brain using LC–MS–MS. 5 contents were determined in rat blood and brain 0, 10, 30, and 60 min following sc injection at the dose of 2 mg/kg. Values represent the ratio between the peak area of the analyte (AN) and the peak area of the internal standard (IS). Average (±SEM) for each time point is plotted. For detailed statistics, see “Results”.
