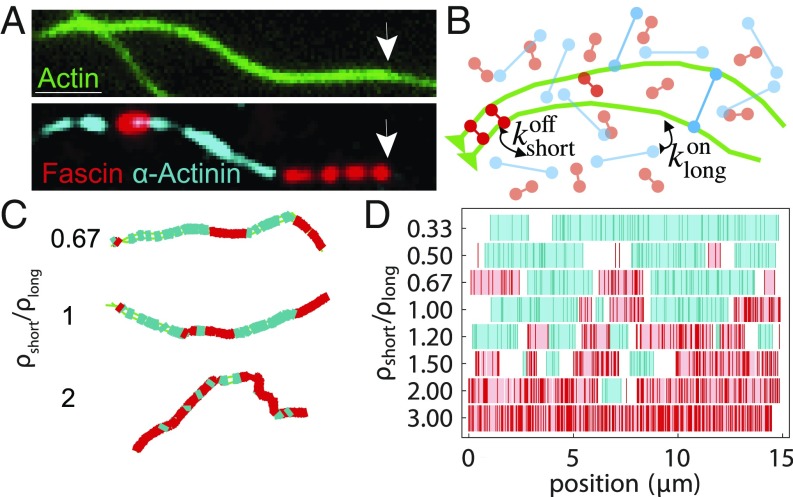
Fig. 1.
Cross-linker segregation in experiment and simulations. (A) Experimental 3-color TIRF microscopy image showing 2 cross-linkers, fascin (red), and -actinin (cyan) in domains on a 2-filament actin bundle (green; arrows indicate polymerizing barbed end). (Scale bar: .) Adapted from ref. 16. (B) Schematic of AFINES simulation: 2 filaments (green bead spring chains) are combined with 2 populations of cross-linkers, short (red) and long (cyan) that are represented as Hookean springs, which can dynamically bind and unbind from filaments. (C) Bundles formed in AFINES simulations by two 15-m filaments mixed with long cross-linkers ( nm; cyan) and short cross-linkers ( nm; red). (D) Domain calculations for different density ratios. Cyan (red) lines show discretized position of long (short) cross-linkers, light blue (pink) regions show extracted domains, and white regions are gaps. See SI Appendix, Table S1 for the list of parameter values for all AFINES simulations in this paper and https://github.com/Simfreed/AFINES for AFINES software and inputs (39).

