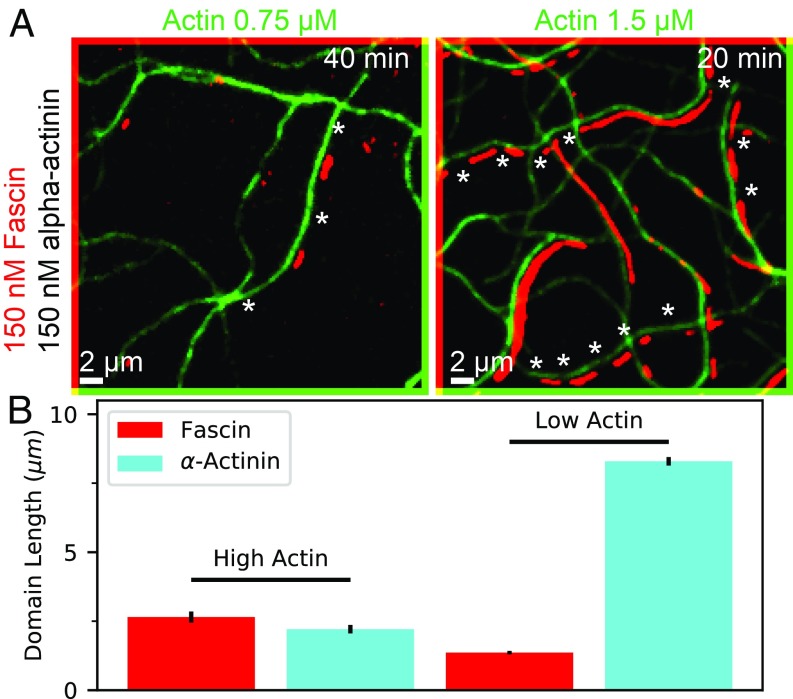
Fig. 4.
TIRF microscopy experiments show effect of polymerization on cross-linker domain formation. (A) Two-color TIRF microscopy image of actin filaments combined with fascin (labeled) and -actinin (unlabeled) at 2 different actin concentrations (images diagonally offset by 2 pixels in each direction for clarity). Measured actin polymerization rates are nm/s and nm/s at high and low actin concentrations, respectively. -Actinin domains are inferred from regions with double actin fluorescence but no fascin (examples shown with stars). Full field of view is shown in Movies S4 and S5. Experiments using labeled -actinin and labeled fascin conform with these results but are harder to quantify (ref. 16 and SI Appendix, Fig. S4). (B) Domain length for fascin and -actinin for both conditions, averaged over 2 replicates each; error bars are SEM over replicates.

