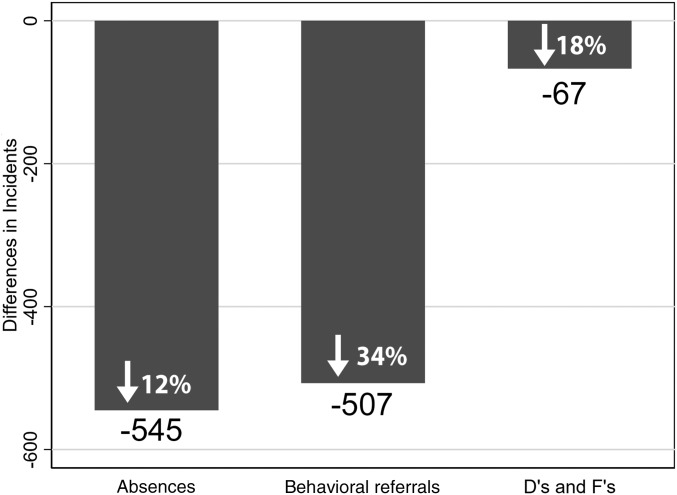
Fig. 3.
Differences in number and rate of absences, behavioral referrals, and Ds and Fs between intervention and control groups. The figure represents unadjusted aggregate intervention minus control group differences. Behavioral referrals and absences for each student are top-coded at 35 and 45 incidents, respectively, to account for outliers.

