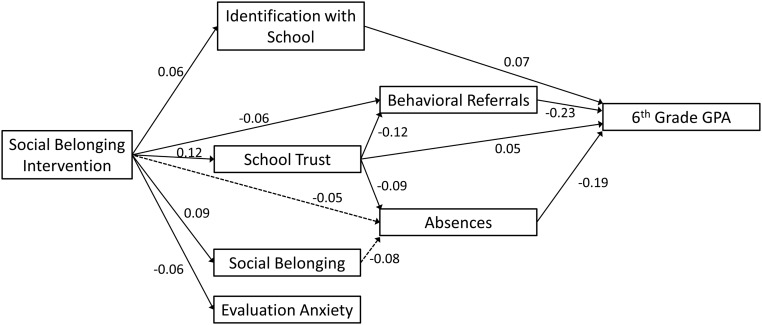
Fig. 4.
Empirical path model. Path coefficients are standardized. SEs are clustered at the school level. Solid lines indicate path coefficients statistically significant at P < 0.05. Dashed lines indicate path coefficients statistically significant at P = 0.05 to P < 0.10. Path coefficients at P = 0.10 or greater are not shown, but all paths between variables were included in the model. The model also included controls for gender, race, prior achievement, disability status, free or reduced-price lunch eligibility, English language learner status, and 2- and 3-way interactions for race, gender, and experimental group. Both student well-being measures and behavior measures were allowed to covary.

