Fig. 6.
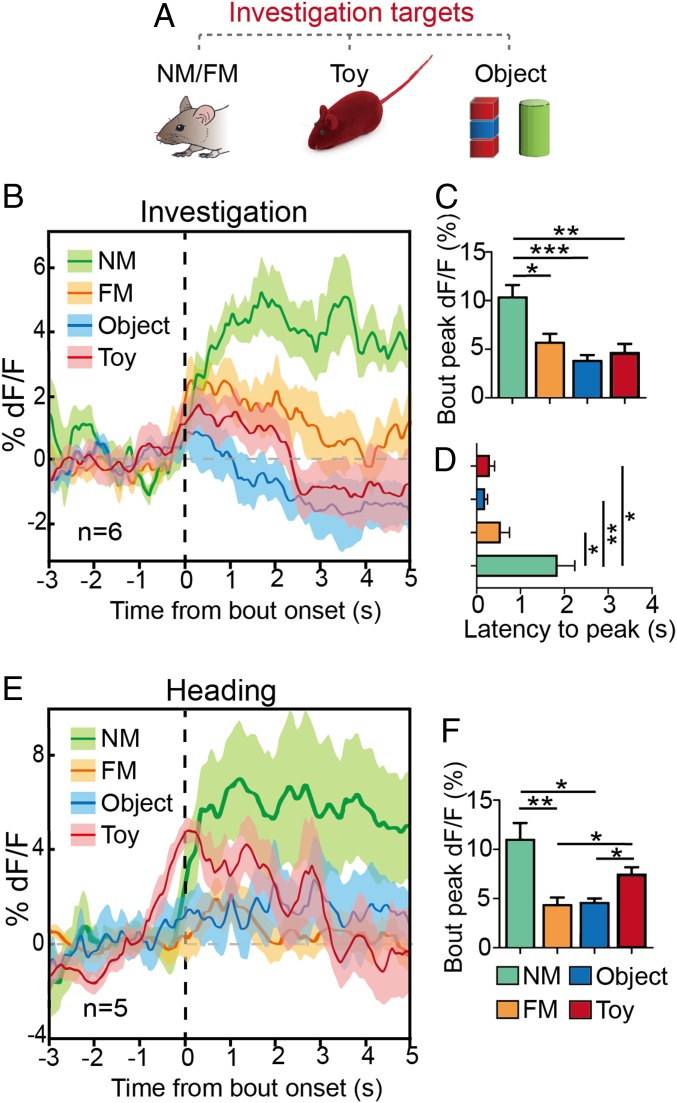
Real-time Ca2+ dynamics of vCA1-PVIs in target investigation. (A) Ca2+ signals were recorded when a subject mouse investigated a familiar mouse, a novel mouse, a toy mouse, and a novel object individually. (B) Averaged time course of Ca2+ transients in freely moving mice (n = 6) investigating different targets. (C and D) Quantitative analyses of peak (C) and latency to peak (D) dF/F of Ca2+ signals when PV-GCaMP6 mice investigated different targets. (E) Averaged time course of Ca2+ transients in freely moving mice (n = 5) heading toward different targets. (F) Quantitative analysis of peak dF/F of Ca2+ signals when PV-GCaMP6 mice head toward different targets. All data are expressed as mean ± SEM. In the time curve graphs, the cloudy area indicates SEM of the averaged data. *P < 0.05; **P < 0.01; ***P < 0.001.

