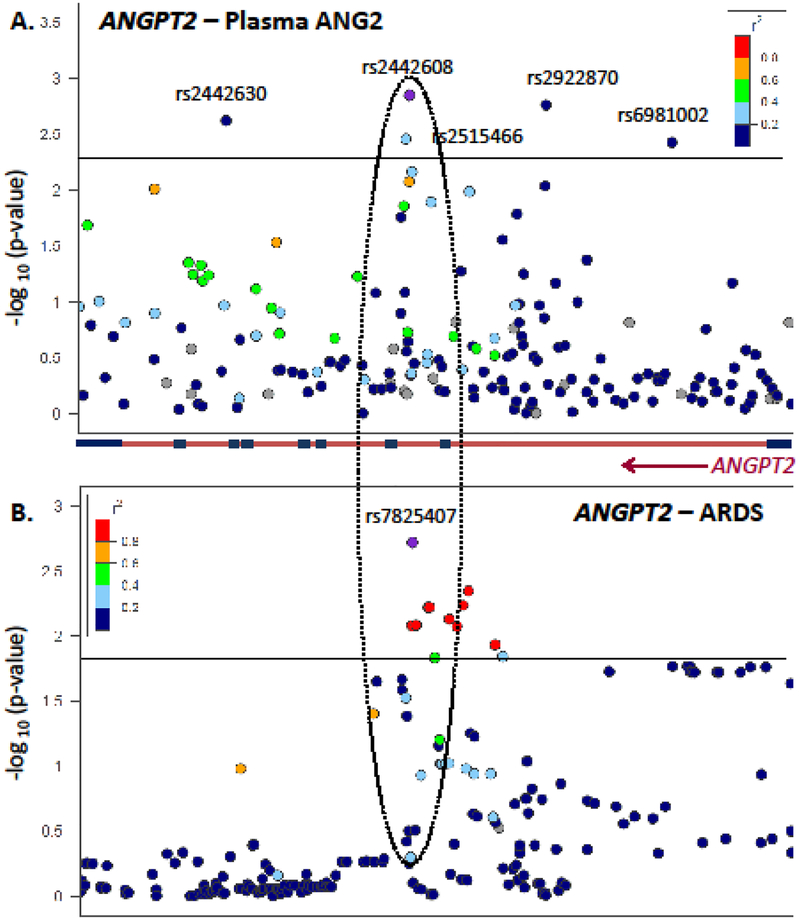
Figure 1: Regional association plots demonstrate a consistent region of association between the ANGPT2 gene and plasma ANG2 (panel A) and previously reported trauma-associated ARDS (panel B).
Panel A depicts the regional association plot between loci on the ANGPT2 gene (chromosome 8) on the x-axis, and the strength of association with plasma ANG2 in early sepsis among EA shown as -log(p-value for ANG2 association) on the y-axis. Single nucleotide polymorphisms (SNPs) with association more extreme than p=0.005 are labeled, with rs2442608 being the most extreme SNP from the QTL analysis. Color-coding depicts the strength of linkage disequilibrium (LD) between rs2442608 and other loci, with increasing LD represented by increasing red. Navy represents minimal LD with rs2442608. A schematic of the ANGPT2 gene is depicted as a red bar with blue exons and an arrow to indicate the direction of transcription. Panel B depicts the regional association plot between the same region of chromosome 8 with trauma-associated ARDS as reported in our prior study [22]. The most extreme SNP from that association, rs7825407, is in moderate LD with rs2442608 (r2=0.37) in EA populations [42], replicating the importance of this ANGPT2 intron for ARDS and providing functional relevance for this locus. Plots were created using LocusZoom [43].

