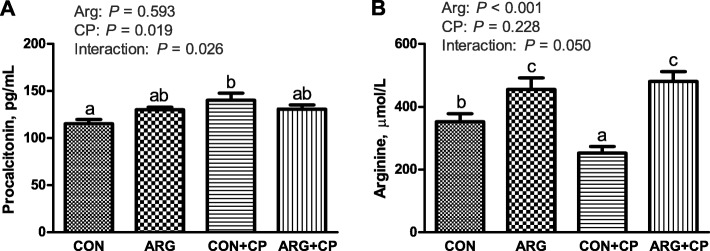
Fig. 2.
Serum procalcitonin (a) and arginine (b) concentrations of broiler chickens. CON group, received a basal diet; ARG group, fed a basal diet supplemented with 3 g/kg arginine; CON+CP group, received a basal diet and underwent C. perfringens challenge; ARG + CP group, given a basal diet supplemented with 3 g/kg arginine and underwent C. perfringens challenge. The results are expressed as means ± SEM (n = 8). Different letters indicate significant differences for the interaction effect (P ≤ 0.05)

