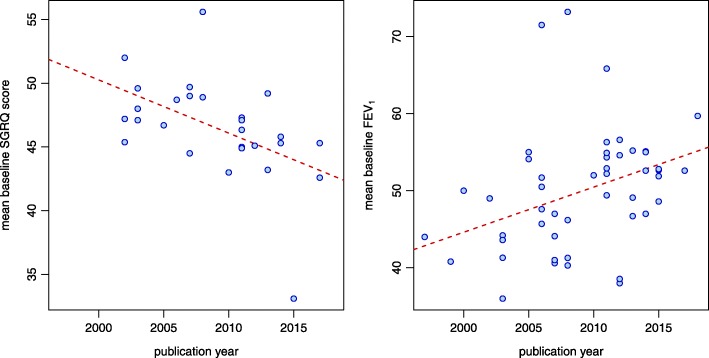
Fig. 3.
Time trends in baseline mean SGRQ score (left panel) and baseline mean FEV1 (right panel). Baseline values are available for 27 and 50 of the 55 studies, respectively. Correlation coefficients are − 0.50 for SGRQ, and + 0.36 for FEV1. The red dashed lines illustrating the trends are least-squares fits to the data

