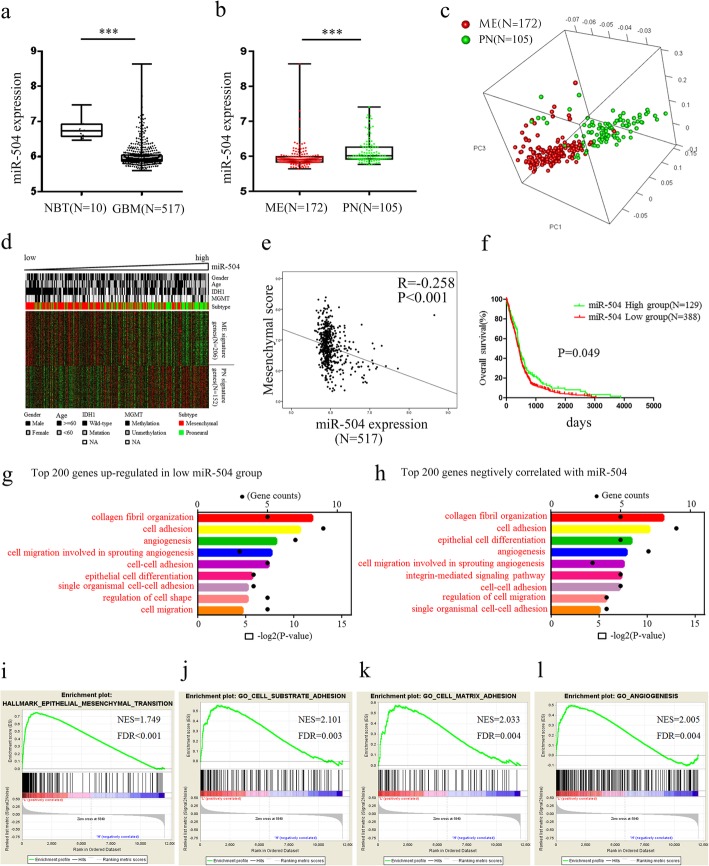
Fig. 1.
Downregulation of miR-504 in ME subtype GBM. a Analysis of TCGA data of miR-504 expression levels in NBT (n = 10) and GBM (n = 517). b Analysis of TCGA data of miR-504 expression levels in ME subtype GBM (n = 172) and PN subtype GBM (n = 105). c PCA based on the miR-504–related genes shows a distinct distribution pattern between patients with the ME and the PN subtype. d The expression pattern of ME and PN signature genes corresponding to miR-504 expression. e Pearson correlation analysis between miR-504 and ME score in TCGA. f Kaplan–Meier analysis of overall survival of patients with GBM from TCGA database according to miR-504 expression level. g GO analysis of the top 200 differentially upregulated genes in miR-504 low-expression tumors. h GO analysis of top 200 genes negatively related to miR-504. i–l GSEA highlighting positive association of decreased miR-504 expression levels with EMT, cell adhesion, and angiogenesis. ***P < 0.001

