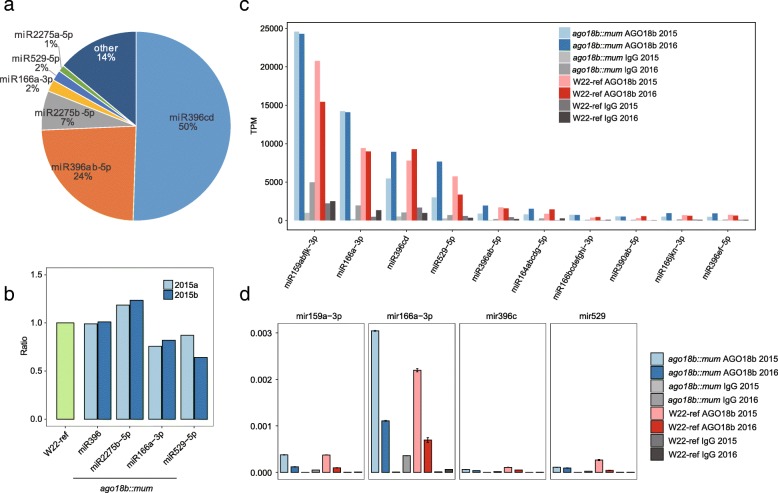
Fig. 5.
The expression regulation of miR166a by AGO18b binding. a Pie chart showing the percentage distribution for miRNAs in the total miRNA reads. b Bar plot showing the ratio of miRNA between W22 and ago18b::mum samples from sRNAome sequencing data. c Bar plot showing the abundance (TPM) of AGO18b-associated miRNAs in AGO18b-associated sRNA libraries. d Bar plot showing the relative abundance of AGO18b-associated miRNAs relative to IgG controls by quantitative PCR experiment

