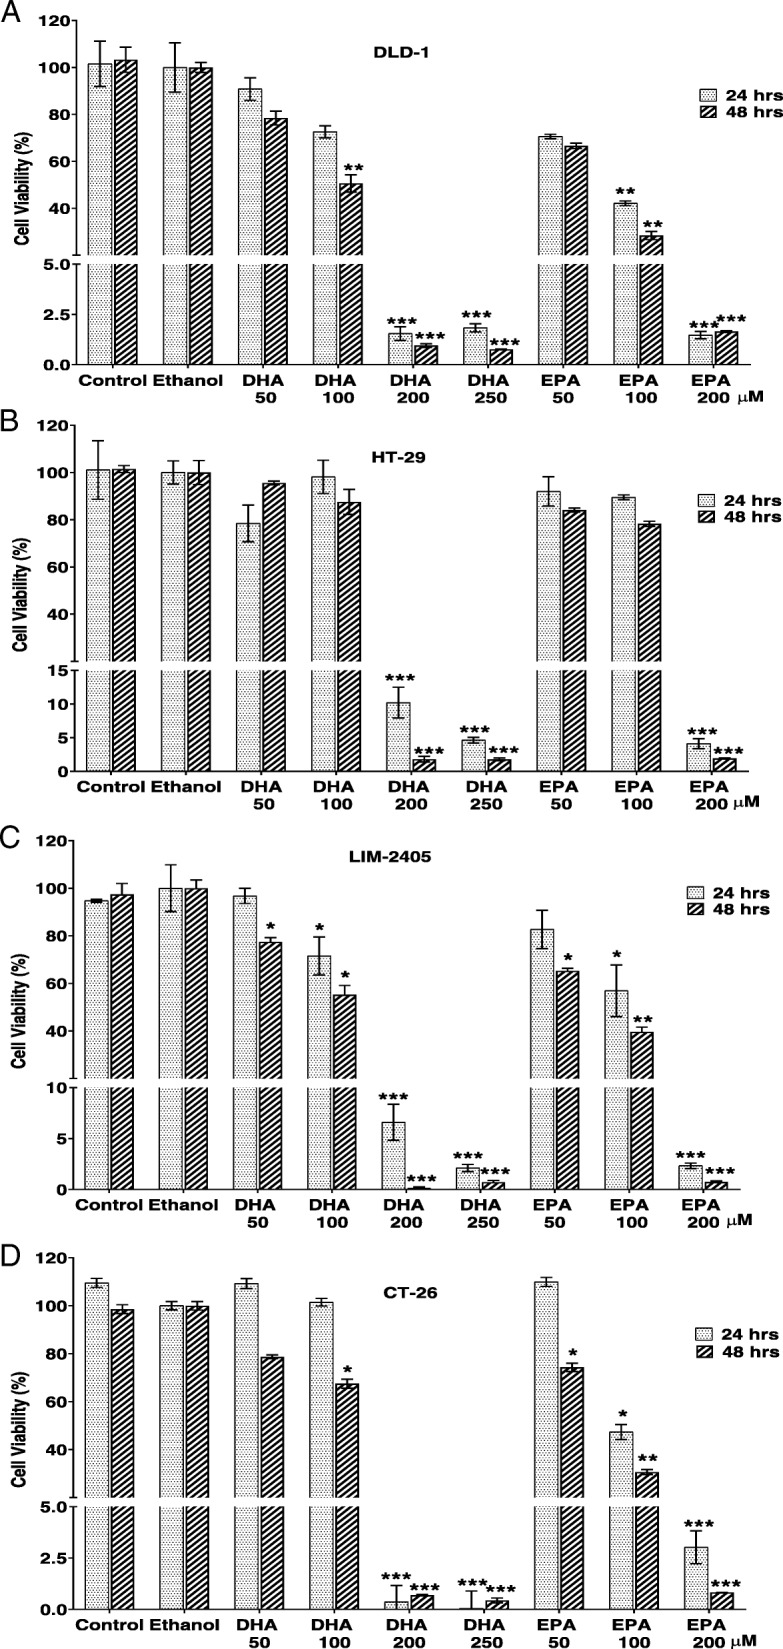
Fig. 2.

Proliferation of CRC cells following treatment with EPA and DHA. Cell viability of DLD-1 (a), HT-29 (b), LIM-2405 (c) and CT-26 (d) cells were determined using WST-1 assay following treatment with DHA and EPA for 24 and 48 h. The experiment was repeated three times for each cell line. Data are expressed as mean ± SEM (n = 3), *p < 0.05, **p < 0.01 and ***p < 0.001 indicate a significant difference between the treatment and Ethanol (vehicle) control
