
Fig. 3.
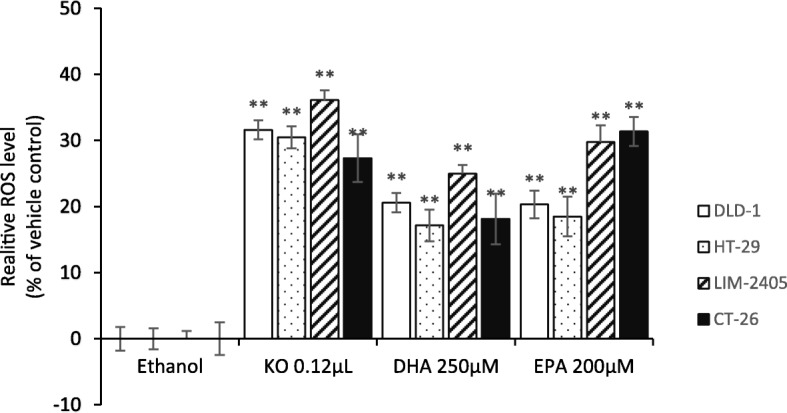
ROS formation in mitochondria of CRC cells after 24 h of treatment with FFAE of krill oil, EPA and DHA. The mitochondrial superoxide level was measured using the MitoSox™ and was presented as a percentage comparison to the ROS level in Ethanol (vehicle) treated cells. Three replicates for each treatment and two individual experiments were performed. Data are expressed as mean ± SEM (n = 3). **p < 0.01 indicates a significant difference between the treatment and Ethanol (vehicle) control