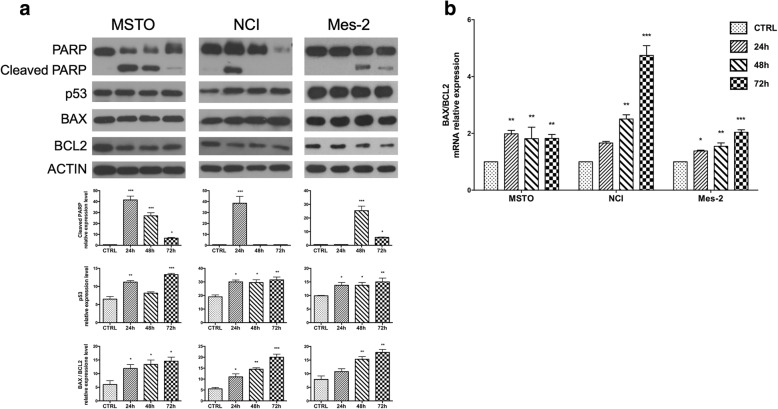
Fig. 4.
CBP induces intrinsic apoptosis. a) Protein expression levels of p53 and apoptotic markers in MM cell lines after 20 μM CPB for 24, 48 and 72 h treatments analysed by Western blot analysis. Histograms report the expression of p53, cleaved PARP and Bax/Bcl2 ratio normalized expression. β-Actin was used as loading control. b) Quantitative analysis of mRNA expression levels of Bax and Bcl-2 in mesothelioma cell lines after 24, 48 and 72 h of CBP treatment. The bars represent ± the average ± SD of independent experiments (n = 3). Statistically significant difference compared to untreated cells: **p ≤ 0.01, ***p ≤ 0.005. CTRL: untreated cells after 72 h culture

