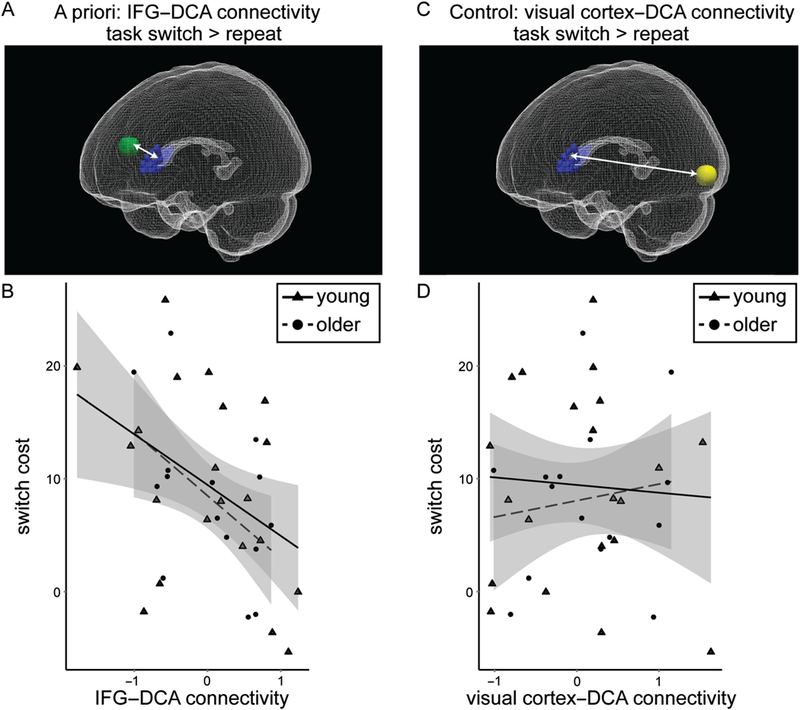
Figure 3.

Frontostriatal functional connectivity associated with task-switching performance. (A) PPI functional connectivity was measured between bilateral DCA (blue) and left IFG (8-mm sphere surrounding MNI −54, 14, 18; green) for task switch > repeat trials. This image was created using ITK-Snap (Yushkevich et al., 2006) and ParaView (Ahrens, Geveci, & Law, 2005). (B) IFG-DCA functional connectivity was correlated with switch cost (r = −.46, p = .005) for young and older adults combined. Young adults are displayed as triangles with a solid line indicating the correlation for young adults alone, and older adults are displayed as circles with a dashed line indicating the correlation for older adults alone. 90% Confidence interval is displayed in gray. (C) Functional connectivity was measured between bilateral DCA and left visual cortex (8-mm sphere surrounding MNI −28, −96, −6; yellow) for task switch > repeat trials. (D) Visual cortex-DCA functional connectivity was not correlated with switch cost (r = −.01, p = .97) for young and older adults combined.
