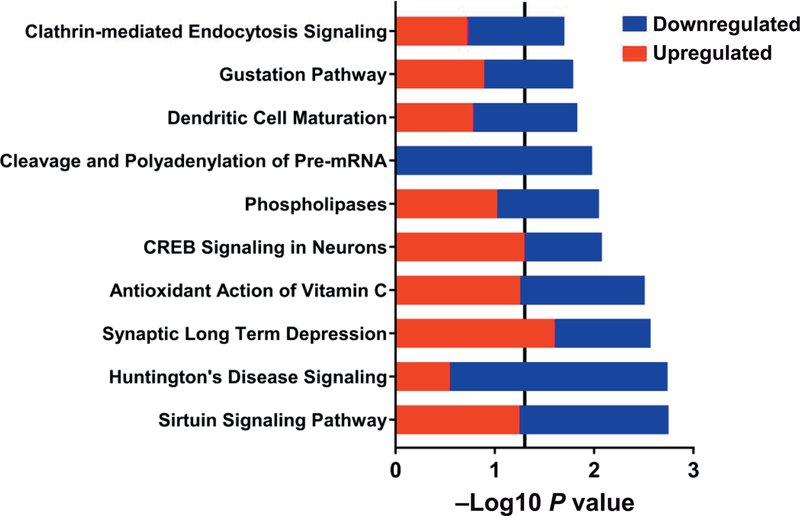
FIG. 8.
Intermediate monocyte canonical pathways differentiating irradiated vs. control subjects using cross-sectional and longitudinal differentially expressed genes. Within each pathway red bars indicate the proportion of DEGs upregulated in irradiated monocytes at 6 months, blue bars indicate the proportion of DEGs downregulated in irradiated monocytes at 6, and the overall height of the bar is the −log10 P value. The vertical line indicates the threshold for significance based on a −log10 P value of 1.3 (equal to P < 0.05).

