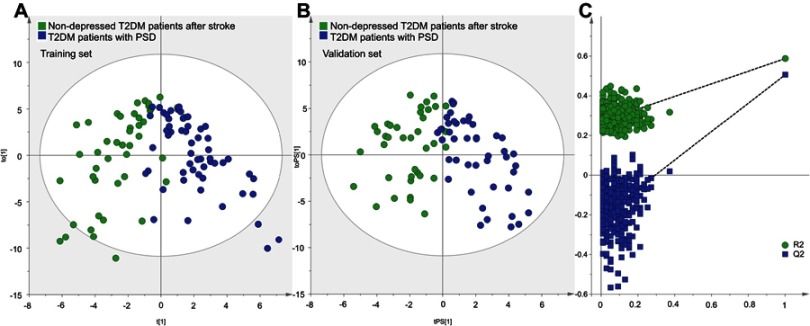
Figure 1.
Metabolomic analysis of urine samples from the two groups: (A) OPLS-DA model built with training set (green dot, nondepressed T2DM patients after stroke; blue dot, T2DM patients with PSD); (B) T-predicted scatter plot built with validation set (green dot, nondepressed T2DM patients after stroke; blue dot, T2DM patients with PSD); (C) 399-item permutation test.
Abbreviations: T2DM, type 2 diabetes mellitus; PSD, post-stroke depression; OPLS-DA, orthogonal partial least-squares discriminant analysis.

