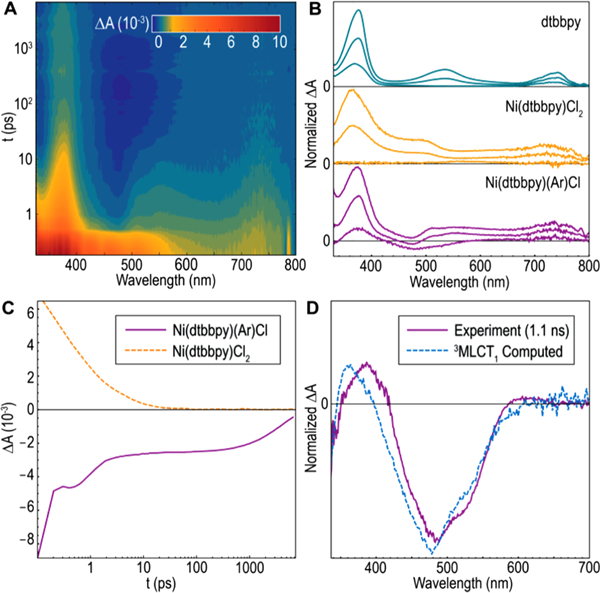
Figure 3.

Initial transient absorption experiments. (A) Full contour plot for TA spectrum of 1-Cl (pump 295 nm). (B) Comparison of TA spectra of free dtbbpy (1–1000 ps, pump 305 nm), Ni(dtbbpy)Cl2 (1–60 ps, pump 295 nm), and 1-Cl (1–1000 ps, pump 295 nm ).(C) Single-wavelength kinetics for Ni(dtbbpy)Cl2 (367 nm, pump 295 nm) and 1-Cl (476 nm, pump 400 nm). (D) Experimental spectrum versus simulated 3MLCT1 spectrum of 1-Cl.
