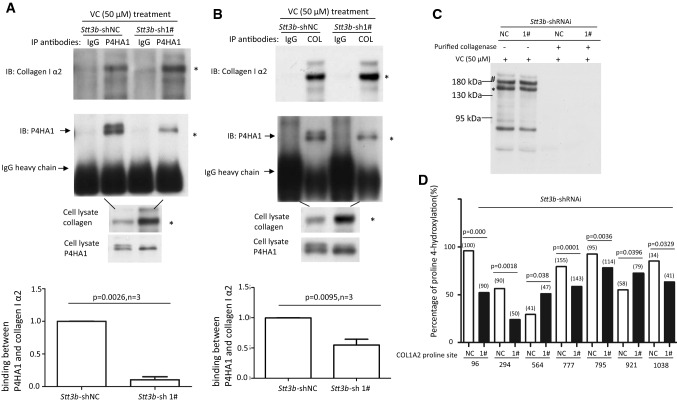
Fig. 6.
Lack of N259 glycosylation on P4HA1 reduces P4HA1 association with col 1α2. Co-IP was performed with anti-P4HA1 (a) or anti-Type I collagen (b) antibody (2 μg) using 1 mL of cell lysate. Co-purified col 1α2 and P4HA1 were identified by immunoblot analysis using corresponding antibodies. IgG heavy chain was marked. Immunoblot analysis for col 1α2 was performed with 20 μL of cell lysate. The presence of N259 glycosylation on P4HA1 was indicated by two bands recognized by P4HA1 antibody. Statistical analysis showed that the presence of N259 glycans on P4HA1 significantly enhanced the association between col 1α2 and P4HA1 when Co-IP was performed with anti-P4HA1 antibody (n = 3) (a) and anti-Type I collagen antibody (n = 3) (b). The ratio between P4HA1 and col 1α2 in control MEF cells was defined as 1. The relative ratio between P4HA1 and col 1α2 in Stt3b-silenced cells was calculated based on densitometry on immunoblots assessed by Image J using ratio between P4HA1 and col 1α2 from control cells as standard. c Immunoblotting with Type I collagen antibody confirmed that Type I collagen was loaded equivalently from Stt3b-silenced or control MEF cells (indicated by asterisk and hash). The slices in a Coomassie brilliant blue stained gel corresponding to the immunoblotting were cut and subjected to mass spectrometry analysis. d Significant differences in proline hydroxylation on col 1α2 were observed between Stt3b-silenced and control cells. The number of peptide containing specific proline sites identified by mass spectrometry was included in the bracket. p value was indicated for each proline site which showed significant differences in hydroxylation between control and Stt3b-silenced cells. NC Stt3b-shRNAi-negative control (white bars); 1# Stt3b-shRNAi-1# (black bars). Chi-square analysis was used to analyze differences at each proline site on Type I collagen

