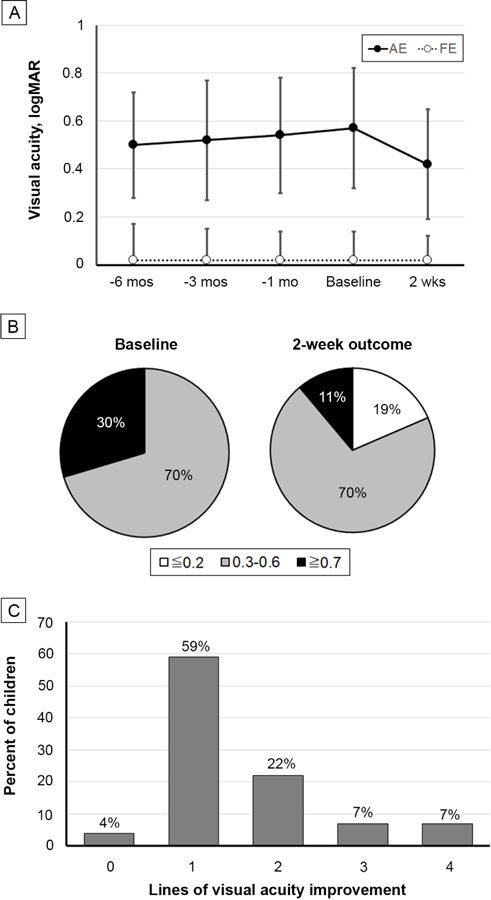
FIG 1.

A, Best-corrected visual acuity (mean with standard deviation) of the amblyopic and fellow eyes for the baseline and 2-week primary outcome visits. Also shown are retrospective data at 6 months, 3 months, and 1 month prior to baseline, obtained from medical records for 20, 23, and 27 of the 27 participants, respectively. B, Percentages of children with severe (≥0.7 logMAR), moderate (0.3–0.6 logMAR), and mild or no (≤0.2 logMAR) amblyopia at baseline and after treatment. C, Number of lines of best-corrected visual acuity improvement from baseline at the outcome examination.
