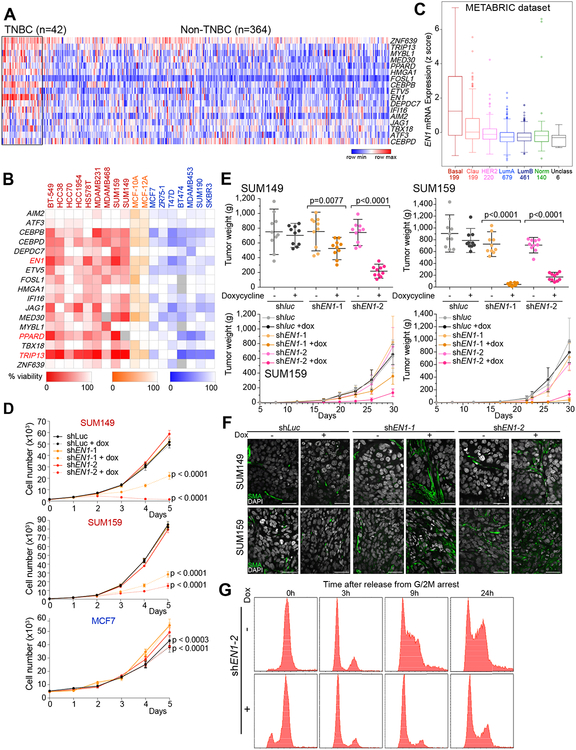
Figure 1. Transcription factors in non-luminal breast cancers.
A, Expression of selected transcription factors in TNBC and non-TNBC breast tumors in the TCGA dataset. Colors reflect z-scores normalized to depict relative values for each factor. B, Heatmap depicting cell viability siRNA screen for 17 transcription factors in 18 breast cancer cell lines; 9 non-luminal (red), 2 immortalized mammary epithelial cell lines (orange), and 7 luminal (blue). Shading indicates percentage (0–100%) of viable cells after siRNA-mediated downregulation of the selected factors compared to non-targeting siRNA control. C, Box plot depicting the expression of EN1 in breast tumor subtypes (basal, claudin-low, HER2, luminal A, luminal B, normal-like, and unclassified) in the METABRIC dataset. Numbers indicate number of tumors in each subtype. D, Proliferation of SUM149, SUM159, and MCF7 cell lines following downregulation of EN1 by TET-inducible shRNAs. shluc was used as control. E, Plots depicting tumor volume and weights at 30 days after injection of TET-inducible shluc- or shEN1-expressing SUM149 and SUM159 cells, respectively, in the presence (+Dox) and absence (-Dox) of doxycycline. F, Immunofluorescence staining of smooth muscle actin (SMA) expression in SUM149 and SUM159 xenografts expressing TET-inducible shluc or shEN1 grown in presence (+) or absence (–) of doxycycline. Scale bars correspond to 50 μm. G, Cell cycle profile of SUM159 cells expressing TET-inducible shEN1 grown in presence (+) or absence (–) of doxycycline, synchronized in G2/M and analyzed at different time points (0h, 3h, 9h, 24h) after release.

