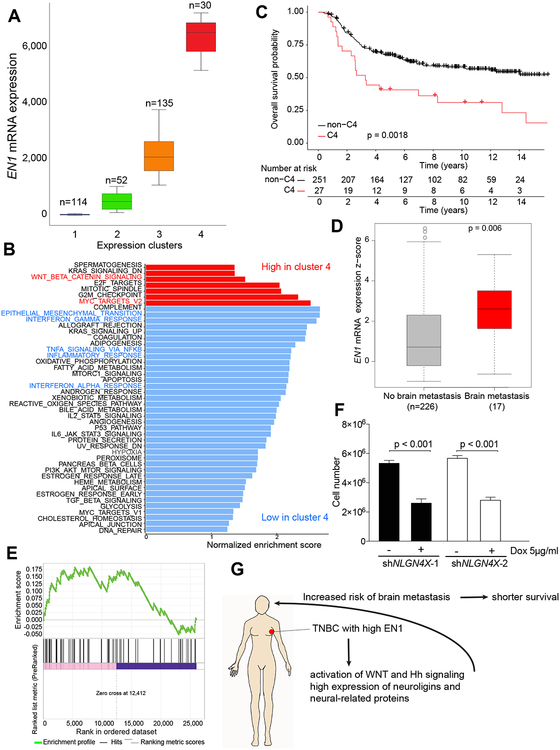
Figure 4. EN1 expression in breast cancer and clinical outcome.
A, Basal breast cancers in METABRIC dataset divided into four different clusters based on EN1 mRNA expression. The number of tumor samples in each cluster is indicated. B, GSEA of genes differentially expressed between tumors in cluster 4 vs. clusters 1–3 combined. C, Kaplan-Meier survival plot showing overall survival of breast cancer patients with basal breast cancer in the Metabric cohort classified into cluster 4 (C4) and all other clusters (Cluster 1–3) combined based on EN1 expression. p-value indicated the statistical significance of the observed difference. D, The expression of EN1 in primary TNBCs with and without brain metastasis in the Metabric cohort. E, GSEA analysis depicting enrichment of matched primary vs. brain metastatic TNBC samples in genes that go up after EN1 knockdown in SUM149 and SUM159 cells (p-val = 0.01). F, Cellular viability after NLGN4X downregulation in SUM159 cells. G, Schematic summary of our EN1 data.

