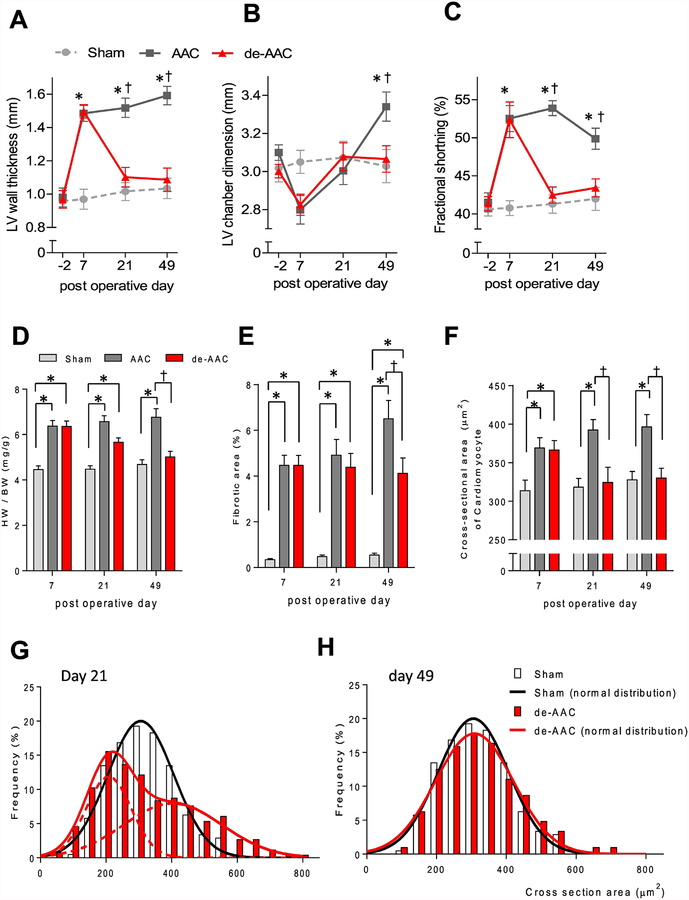
Figure 1. Structural, morphological and cellular remodeling secondary to LV pressure overload and release.
A serial transthoracic echocardiographic measurement indicated that changes in (A) LV diastolic wall thickness, (B) LV diastolic chamber dimension, and (C) fractional shortening after AAC (AAC, black line, *p< 0.05 vs sham, †p <0.05 vs de-AAC). Such alterations were restored to the level similar to sham operated animals (Sham, grey dashed line) at 14 days post removal of the aortic constriction (de-AAC, red line). Similarly, the AAC increased (D) heart weight/body ratio (*p< 0.05 vs sham, †p <0.05 vs AAC) and (E) tissue fibrosis (*p< 0.05 vs sham, †p <0.05 vs AAC) were also diminished in de-AAC groups (red bar) as compared to the AAC group (grey bar) to the level of the sham-operated (light grey bar) mice. N= 4 each for AAC, de-AAC and sham animals. Immunohistochemical analysis using WGA staining showed that (F) cardiomyocyte cross sectional area increased following aortic constriction (AAC: dark grey bar; de-AAC: red bar; Sham: light grey bar). However, two weeks and six weeks following removal of the aortic constriction, the myocyte cross sectional area return to the area similar to sham operated group (light grey bar, *p< 0.05 vs sham, †p <0.05 vs AAC). Further analysis of the distribution of cross-sectional area the WGA stained section, the data revealed that (G) a double peaked distribution of cardiomyocyte cross-sectional area was observed at day 21. (H) This distribution was normalized at day 49 (sham; n=4, de-AAC; n=4). Five hundred cardiomyocyte from cross sectional areas in each mouse, for a total of 2,000 cardiomyocytes, were measured in each group to generate this histogram.

