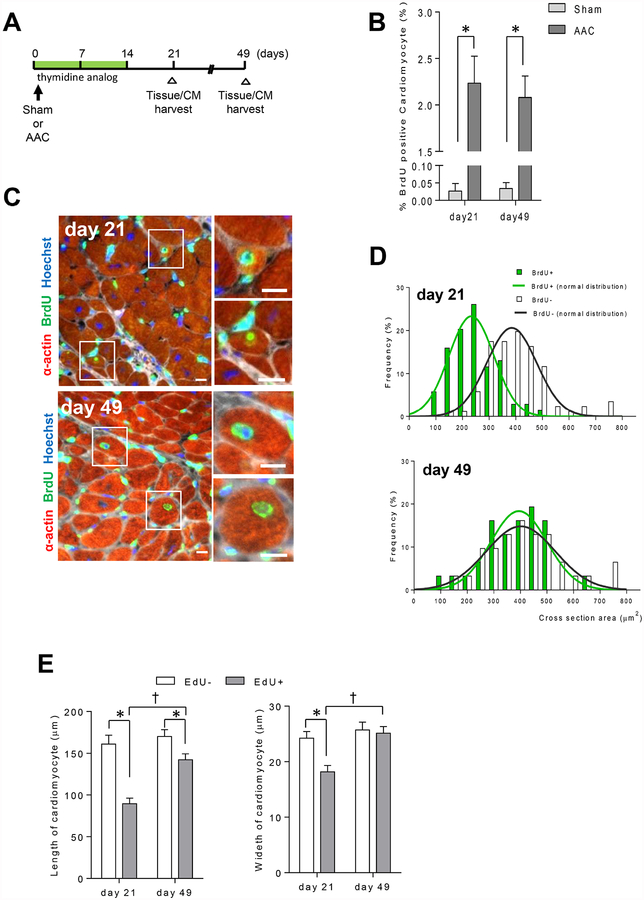
Figure 2. Pressure overload triggers cardiomyocytes proliferation.
A. Study design and time line. B. AAC increases the number of BrdU+ cardiomyocytes at 21 days and 49 days post-AAC (*p <0.05 vs sham, sham, light grey bar, n=4, de-AAC, dark grey bar, n=5). C. Representative images of BrdU+ cardiomyocytes at 21 days and 49 days post-AAC (Scale bar; 5 μm. Hoechst, blue; BrdU, green, a-actin, red; WGA, white). D. Distribution of cross-sectional area between BrdU+ and BrdU− cardiomyocytes. BrdU+ cardiomyocytes exhibit smaller cross-sectional area at day 21 in comparison to the cross-sectional area at day 49. Cross sectional areas of forty to 80 BrdU+ cardiomyocytes per sample, for a total of 320 cardiomyocytes were measured. E. Size differences of EdU+ and EdU− cardiomyocyte (*p < 0.05 vs EdU−, †p < 0.05 vs EdU+ at day 21). Eighty EdU+ and 100 EdU- isolated cardiomyocytes’ length and width were measured.

