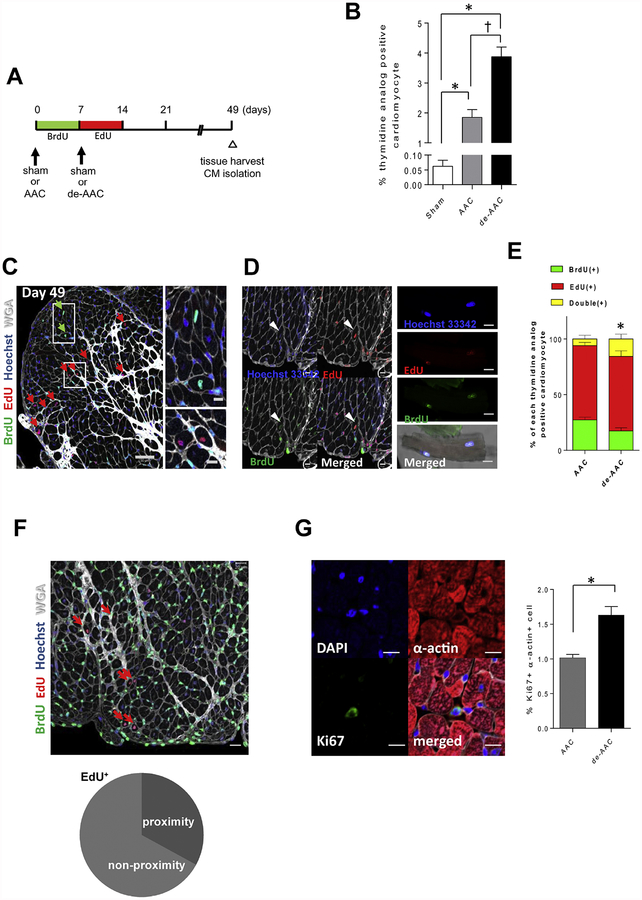
Figure 3. Removal of aortic constriction one-week post-AAC induces further cardiomyocyte proliferation in LV area distant from injury.
A. Study design and timeline. B. Percentage of total thymidine analog positive cardiomyocytes (*p <0.05 vs sham, †p <0.05 vs AAC, n=6 in each group). de-AAC further increases thymidine analog positive cardiomyocytes. C. Representative images of thymidine analog labeling in de-AAC heart sections (Scale bar = 50 μm and 10 μm in the inset). Green and red arrows indicate BrdU+ and EdU+ cardiomyocytes, respectively. D. Double thymidine analog positive cardiomyocyte in heart section (left panel) and isolated cardiomyocyte (right panel). Scale bars indicate 10 μm and 20 μm in left and right panel, respectively. E. Percentage of double thymidine analog positive cardiomyocyte (indicated yellow) in de-AAC is significantly increased compared to that in AAC (*p <0.05 vs AAC). F. Representative images of de-AAC heart sections (upper panels). Red arrows indicate EdU+ cardiomyocytes. Dotted circles indicate EdU+ nuclei in cardiomyocytes (lower right). Scale bars indicate 20 μm. 27.4% (left) and 32.2% (right) of thymidine analog positive cardiomyocytes reside in close proximity in BrdU+ and EdU+ cardiomyocytes, respectively. (n = 6 in each group). G. Representative images of Ki67+ α-actin+ cells. Scale bars indicate 10 μm. Ki67+ α-actin+ cells are increased in de-AAC compared to AAC hearts at post-operative day 9 (2 days after de-AAC, *p <0.05).

