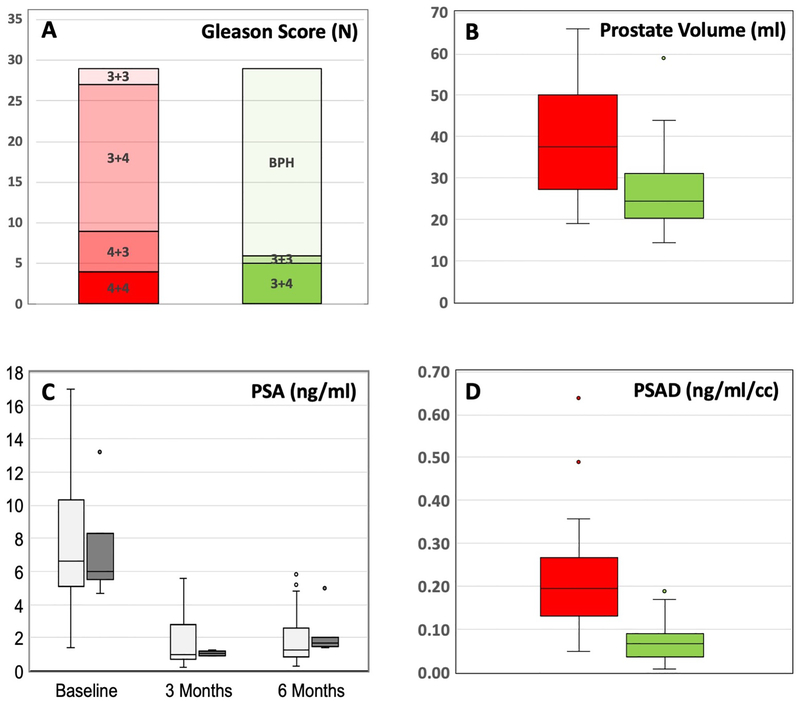
Figure 2.
Chart showing group changes in Gleason Score (A) and Box & Whisker plots showing group changes in prostate volume (B), PSA (C), and PSA density (D) between baseline (red) and 6 months after hemi-gland ablation (green). In C, open box = treatment success (no cancer at f/u biopsy) and dark box = treatment failure (cancer present at f/u biopsy). All changes are statistically significant (p<0.01).

