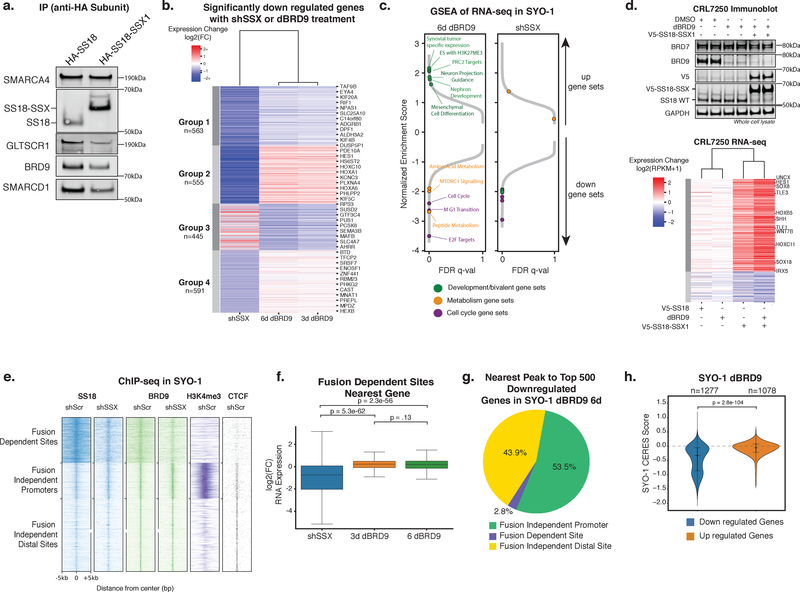
Figure 5. ncBAF is not required for SS18-SSX1-mediated gene expression and primarily regulates fusion-independent sites.
a. Immunoblot for ncBAF components in HA-SS18 and HA-SS18-SSX complex purifications (n=1 biologically independent experiment). See also Supplementary Figure 7h.
b. Heatmap of significantly downregulated genes (p-adjusted<1e-3 and log2(fold change)< -0.59) in shSS18-SSX (7 days post infection) and dBRD9 (3 and 6 days) conditions in SYO-1 cells k-means clustered into 4 groups. n=2 biological replicates for each RNA-seq experiment, p-adjusted values are Benjamini-Hochberg adjusted Wald p-values.
c. GSEA of RNA-seq data for shSS18-SSX and dBRD9 (day 6) conditions in (b). Specific pathways and gene sets are indicated.
d. (Top) Immunoblot on CRL7250 whole cell lysates described in Figure S5B (n=1 biologically independent experiment); (Bottom) Heatmap of log2(fold change) of gene expression in CRL7250 fibroblast cells treated with DMSO, dBRD9, or dBRD9 followed by lentiviral introduction of V5-SS18 or V5-SS18-SSX (n=2 biological replicates for each RNA-seq experiment). Genes included were expressed (>1 RPKM) and had a log2(fold change) of at least +/-.59 in at least one of the conditions. Genes were k-means clustered into 2 groups and samples were clustered hierarchically. See also Supplementary Figure 7i.
e. Heatmap of ChIP-seq read density of SS18, BRD9, and H3K4me3 over SS18 sites in SYO-1 cells (shScr (control hairpin) and shSSX (targeting SS18-SSX) conditions), clustered into 3 groups.
f. Box plot of log2(fold change) in gene expression of genes closest to fusion-dependent sites (n=595) in shSS18-SSX and dBRD9 conditions. n=2 independent samples for each ChIP performed, significance was calculated by two tailed t-test. Box represents interquartile range (IQR), bar in center shows data median. Minima and maxima shown extend to from the box +/- 1.5*IQR.
g. Pie chart representing chromatin landscape (fusion-dependent, fusion-independent promoter, fusion-independent distal) of the nearest BRD9 peak to the top 500 most downregulated genes.
h. Violin plot of CERES scores for genes that changed with a significance of p-adjusted<1e-3 after 6 days of dBRD9 treatment in SYO-1 cells. P-value between conditions calculated by two tailed t-test. Violin plot represents kernel density estimation with data quartiles represented as lines, the data median is shown as a dot.

