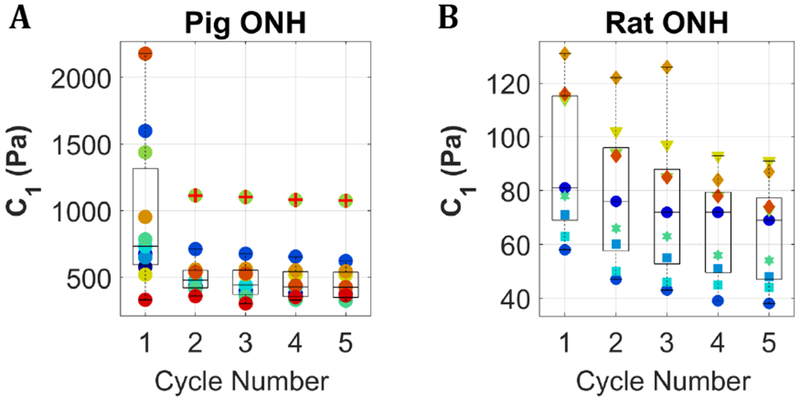
Figure 2:

C1 values for pig and rat optic nerve head samples subjected to cyclic unconfined compression at a 5%/minute strain rate. Colors correspond to individual samples. (A) shows 11 samples. Pig eyes were obtained from a slaughterhouse as a mixed lot on three separate days, thus we can only be certain these samples came from ≥ 7 pigs. (B) shows 9 samples from 5 rats. Different marker shapes correspond to different animals. The central line in each box marks the median, and the box edges mark the 25th and 75th percentiles. Whiskers cover the range of all data points not considered outliers. One sample in the pig data set (panel A) had a consistently high C1 value and was identified as an outlier in cycles 2–5; this is denoted with a red plus sign over the green point markers.
