Figure 3:

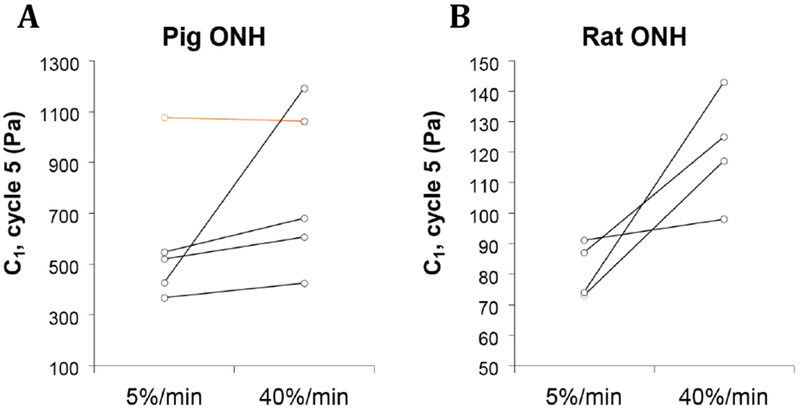
C1 values for a subset of pig (A) and rat (B) samples that were tested at both 5%/min and 40%/min strain rates. The sample identified as an outlier in the larger porcine 5%/min data set (Figure 1) is indicated in orange.

C1 values for a subset of pig (A) and rat (B) samples that were tested at both 5%/min and 40%/min strain rates. The sample identified as an outlier in the larger porcine 5%/min data set (Figure 1) is indicated in orange.