Figure 4 –

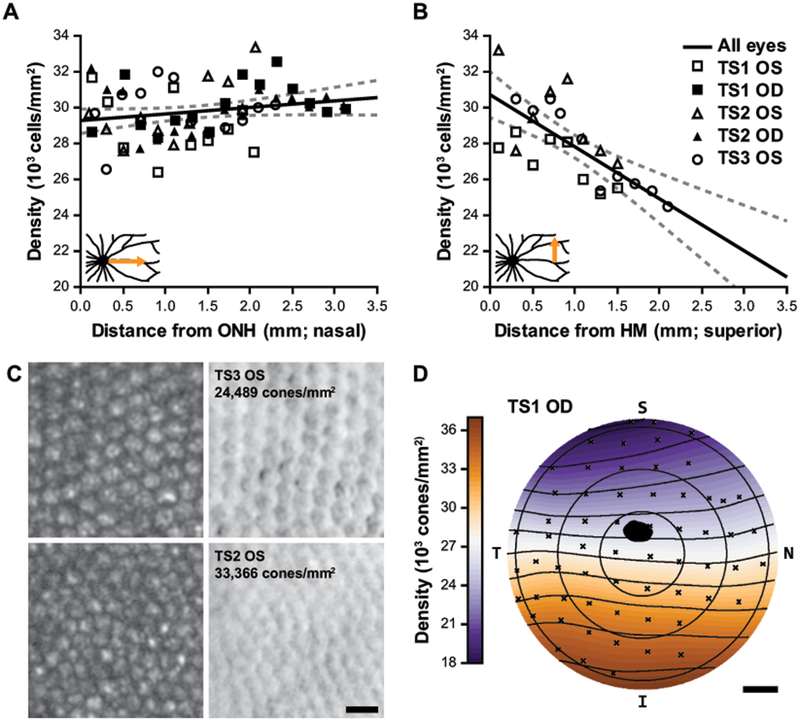
Cone photoreceptor topography. (A-B) Cone densities measured with AOSLO as a function of eccentricity from the optic nerve head (ONH; A) and the approximate horizontal meridian (HM; B). Solid black line: linear regression of measurements for all eyes, dashed lines: 95% CI. Regression analysis did not indicate a significant change in density with nasal eccentricity (A; p = 0.09) but did indicate a significant decrease in density with superior eccentricity (B; m = -2.91E3cells/mm2/mm; p = 3.51E−5). Insets show the schematized retinal regions that correspond to these data. (C) The top panels are the lowest density region analyzed in (A-B); the bottom panels are the highest density region (left and right are confocal and split-detector AOSLO, respectively). Scale bar = 10 μm. The trends in (A-B) correspond well with the topographical map generated from the TS1 OD whole-mount, (D) which demonstrates an overall density gradient decreasing superiorly. The black spot represents the ONH, S = superior; N = nasal; I = inferior; T = temporal; scale bar = 1mm.
