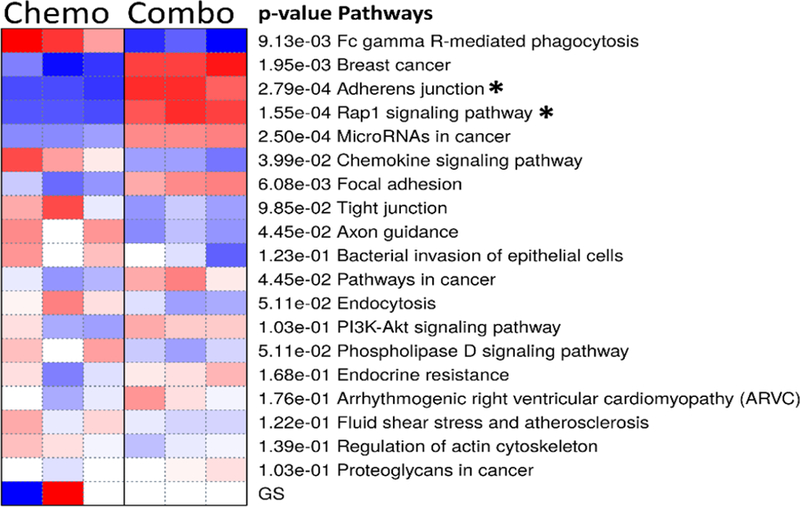
Figure 8.

Heat Map of PAGE for the 20 most significantly enriched KEGG pathways between chemotactic (SDF-1 only) and combinatory electro-chemotactic stimulation. Color intensity represents degree by which a pathway is activated (blue) or suppressed (red).
