
Figure 1.
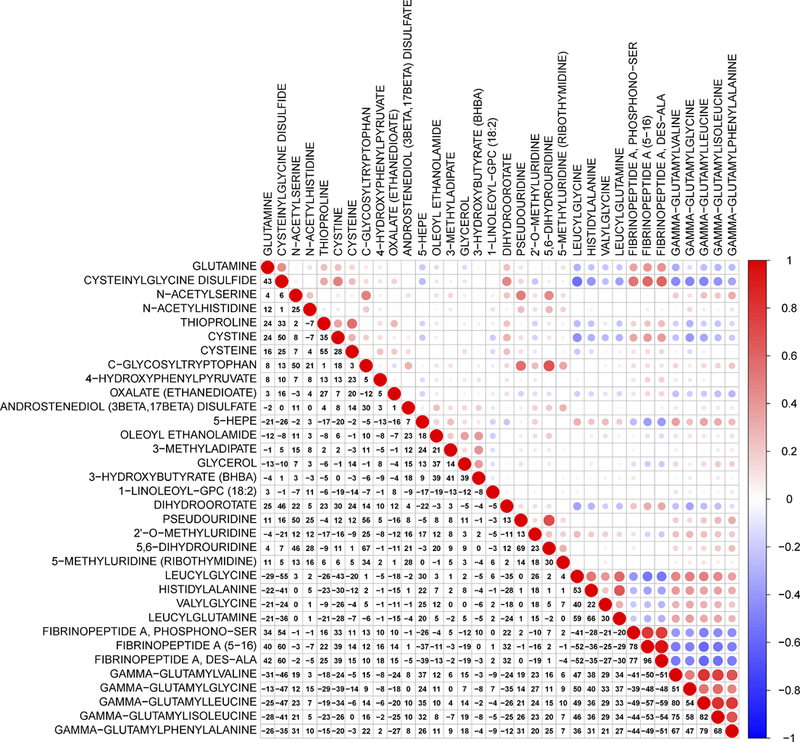
A heat map of correlation coefficients among metabolites associated with lethal prostate cancer. The colors represent the association directions of Pearson correlation coefficients, with red indicating positive correlations, and blue indicating negative correlations. Magnitudes of the correlation coefficients are represented by both numerical percents and circle sizes (i.e., larger circles for stronger correlations).