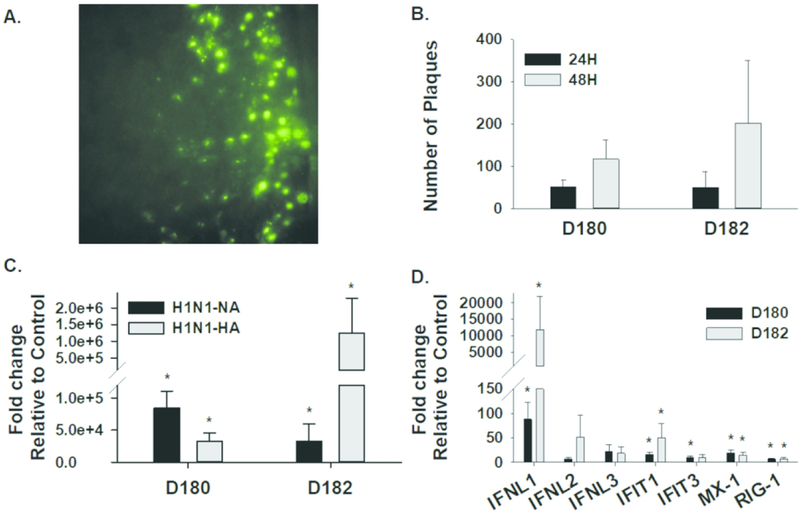
Figure 6. Influenza virus infection of PHLE cells.
PHLE cells differentiated at ALI were challenged apically with infleunza virus. A. Representative image of fluorescent plaques indicative of viral infection. B. The number of individual plaques were counted at 24 and 48 hours, and show an increase over time after infection. C. Expression of two viral transcripts was assessed at 48 hours after infection by qPCR, and compared to uninfected cells (control). Expression of viral transcripts is indicative of a productive infection. D. Expression of interferon ligands (IFNA, IFNB, IFNL½/3) and interferon response genes (IFIT1, IFIT3, MX1, RIG1) was assessed at 48 hours after infection by qPCR, and compared to uninfected cells (control). Evidence of interferon production and signaling indicate a physiological response to infection. “*” P< 0.05,

