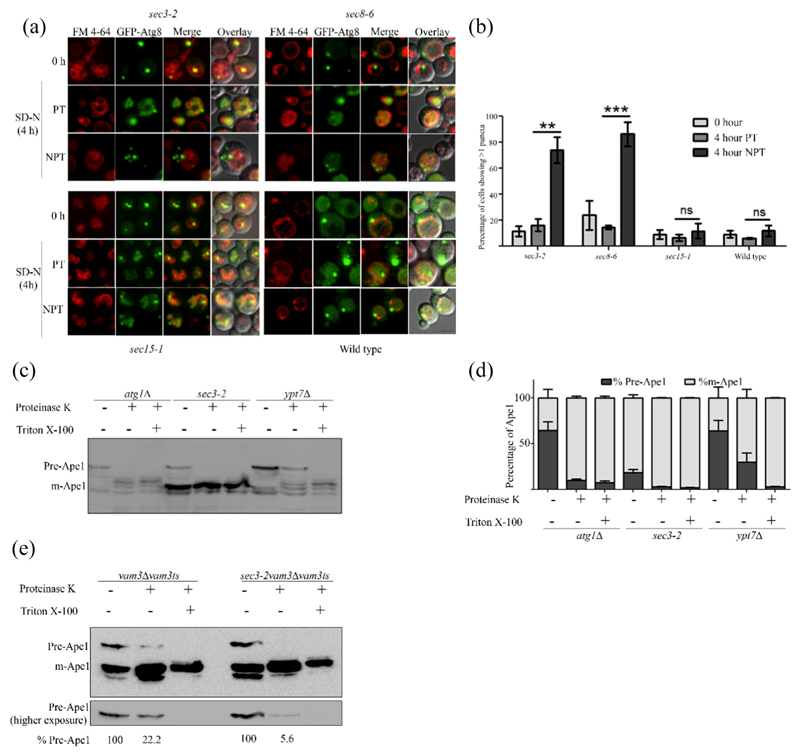
Fig. 2. Mutants of exocyst complex accumulate incomplete autophagosomes.
(a) Cells expressing GFP-Atg8 were cultured in SD-Ura with FM4–64 and moved to starvation at PT and NPT. Fluorescence microscopy images were acquired at 0 and 4 h in SD-N. Maximum intensity projected images are shown. The scale bar represents 2 μm. (b) Cells showing more than one puncta in panel A were scored, and means of three independent experiments are represented in the bar graph. A minimum of 100 cells were counted per experiment. Error bars represent standard error. Statistical significance was analyzed by Student's unpaired t-test. ns, nonsignificant; **P b 0.01, ***P b 0.001. (c) atg1Δ, ypt7Δ and sec3–2cells were starved at NPT for 4 h. Cells were harvested, and spheroplasts were made and lysed. The clarified lysates were treated with either proteinase K or proteinase K with Triton X-100 and analyzed by immunoblotting using anti-Ape1 antibody. (d) Intensities of precursor (Pr-Ape1) and mature Ape1 (m-Ape1) bands in each lane of c were measured using ImageJ (NIH). The percentages of Pr-Ape1 and m-Ape1 were determined and mean of three independent experiments plotted as bar graphs. Error bars represent S.E.M. (e) vam3Δ Vam3ts and sec3–2 vam3ΔVam3ts strains were starved for 4 h at NPT and treated as in panel c. Precursor Ape1 in proteinase K-treated lane relative to precursor form in the control lane is represented as a percentage below the respective lanes of the blot.

