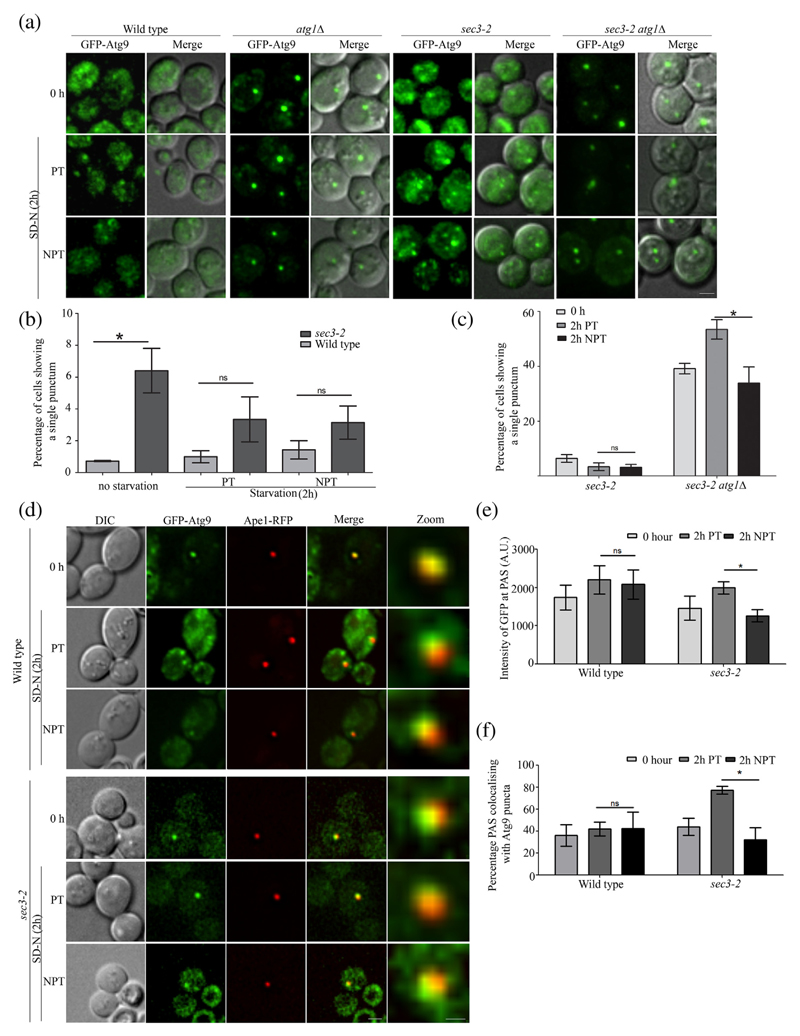
Fig. 3. Anterograde trafficking of Atg9 vesicles is affected in an exocyst mutant.
(a) WT, atg1Δ, sec3–2 and sec3–2atg1Δ cells expressing GFP-Atg9 were grown in SD-Ura and then starved at PT or NPT. Fluorescence imaging was carried out at 0 and 2 h. Deconvolved and maximum intensity projection images are shown. The scale bar represents 2 μm. (b) WT and sec3–2 cells as in panel a were scored for presence of single bright punctum of GFP-Atg9 at 0 and 2 h in starvation at PT and NPT. (c) Comparison of sec3–2 and sec3–2atg1Δ cells showing single punctum of GFP-Atg9 as in panel a. For panels b and c, more than 100 cells per three independent experiments were manually scored and mean values plotted with standard error. (d) WT and sec3–2cells expressing GFP-Atg9 and Ape1-RFP were starved at PT or NPT. Fluorescence images were captured at 0 and 2 h in SD-N. The scale bar represents 2 μm (merge) and 0.5 μm (zoom). Intensity of GFP-Atg9 at PAS (marked by Ape1-RFP) was measured, and average intensity of GFP-Atg9 is plotted in panel e. (f) The percentage of PAS that colocalizes with bright Atg9 puncta was determined from panel d, and mean values were plotted. Error bars represent S.E.M. Statistical significance was analyzed by Student's unpaired t-test. ns, non-significant; *P < 0.05.

