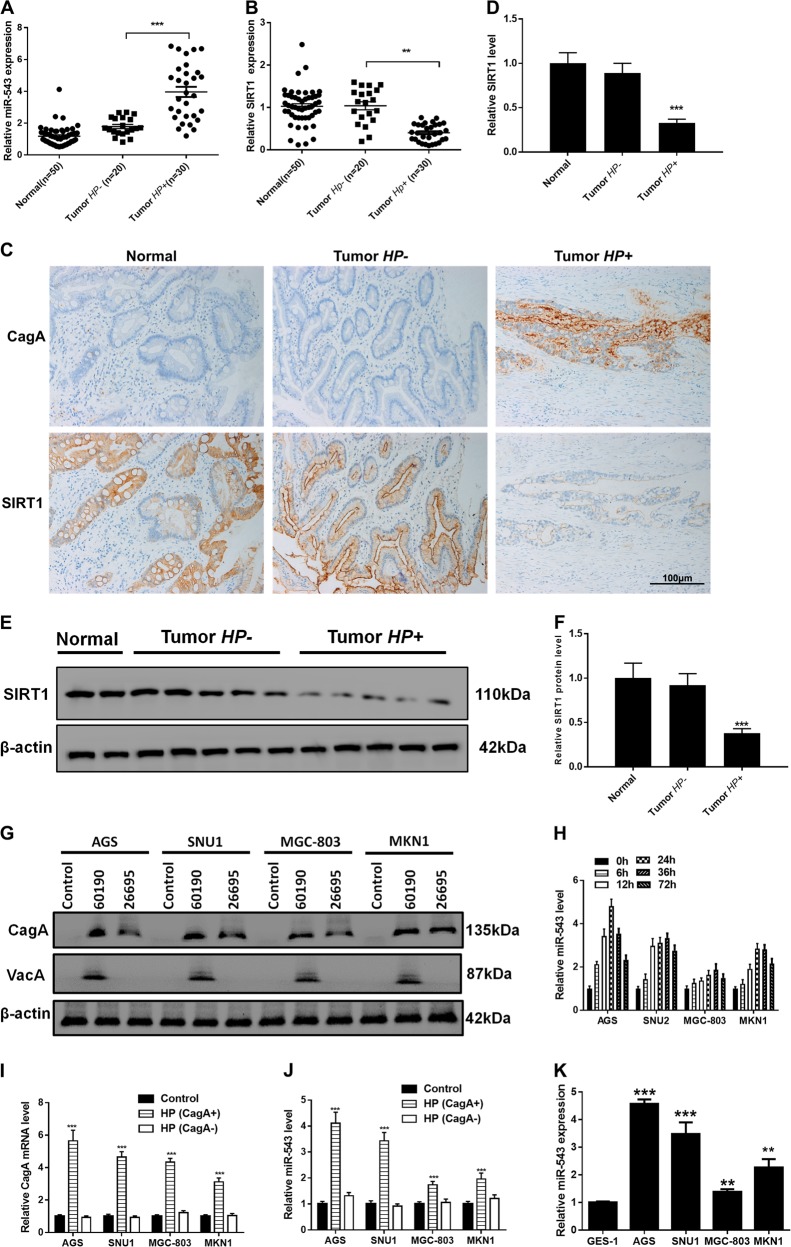
Fig. 1. H. pylori CagA increased expression of miR-543.
a RT-PCR results of miR-543 expression. b RT-PCR results of SIRT1 expression. c IHC experiments of CagA and SIRT1 in normal gastric tissue; HP+ or HP−. d Quantified IHC results. e Western blot results of SIRT1 in tumor tissues; HP+ or HP−. f Quantified western blot results. g Western blot results of CagA and VacA in AGS, SNU1, MGC-803, and MKN1; infected with strain 60190 or 26695. h RT-PCR results of miR-543 in AGS, SNU1, MGC-803, or MKN1 cell lines after infected with H. pylori CagA+ strain 26695 in different hours. i RT-PCR results of CagA in AGS, SNU1, MGC-803, or MKN1 cell lines after infected with H. pylori CagA+ or CagA− strain in 24 h. j RT-PCR results of miR-543 in AGS, SNU1, MGC-803, or MKN1 cell lines after infected with H. pylori CagA+ or CagA− strain in 24 h. k RT-PCR results of miR-543 in GES-1, AGS, SNU1, MGC-803, or MKN1 cells. Data are expressed as the mean ± SD (n = 3). **P < 0.01, ***P < 0.001 compared with control

