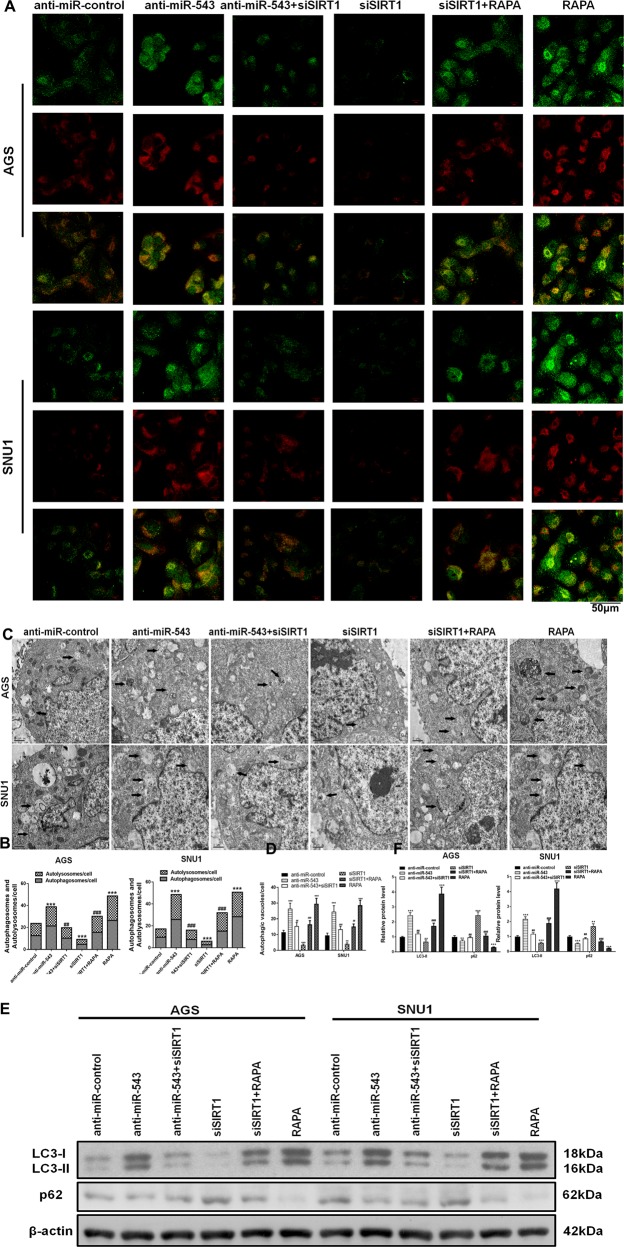
Fig. 6. SIRT1 was targeted by miR-543 to suppress autophagy.
a Detection of autophagy using mRFP-GFP-LC3 in AGS and SNU1 cells transfected with anti-miR-543, siSIRT1, or both anti-miR-543 and siSIRT1. Green puncta indicate the autophagosomes, while the red puncta represent the autolysosomes. Autophagy enhancer RAPA addition and siSIRT1 transfection results were also studied and compared. b Quantitative analysis of mRFP-GFP-LC3 detection. c The autophagic vacuoles (autophagosomes) were detected by transmission electron microscopy (TEM). The representative TEM images are shown and the typical autophagosomes are marked with arrows. d Quantitative analysis of autophagy detection by TEM. e, f Western blot detection of autophagy-related proteins LC3-I, LC3-II, and p62 and Quantified. Data are expressed as the mean ± SD (n = 3). *P < 0.05, **P < 0.01, ***P < 0.001 versus control group; #P < 0.05, ##P < 0.01, ###P < 0.001 versus siSIRT1 group

