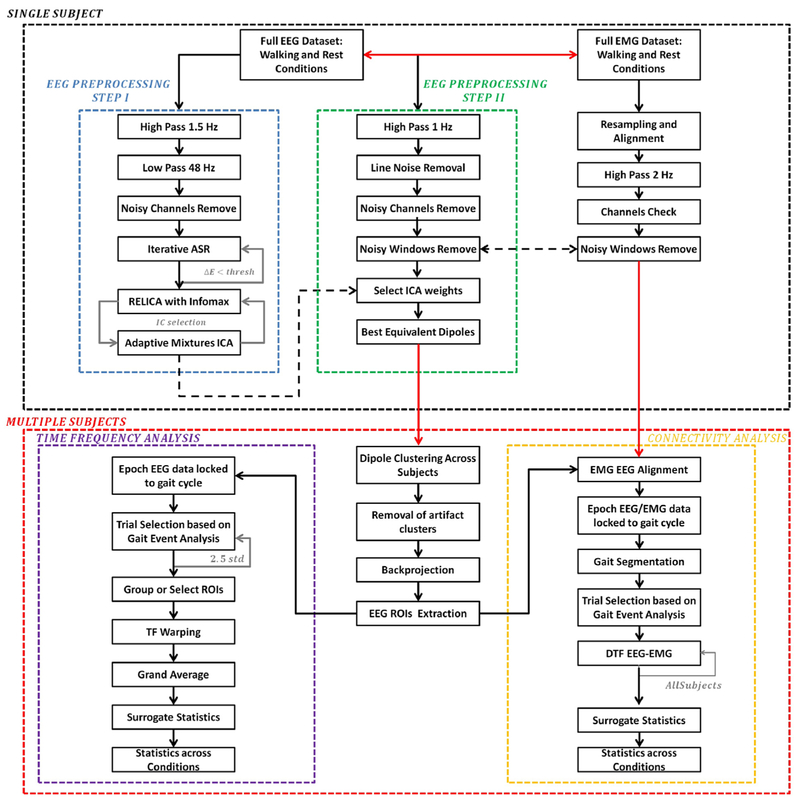
Fig. 2. Schematic showing the EEG and EMG processing steps.
Analyses were performed first at a single subject level (black dotted box) and results were combined to a multiple-subjects level. Single-subject EEG data went through two EEG preprocessing stages, namely Step I (blue box) and Step II (green box). The first is more aggressive and it is specific to maximize extracted ICs reliability. ICs are applied to data processed according to the second preprocessing step, more conservative, with the aim of retaining the maximum amount of information to be used in subsequent time-frequency and connectivity analyses. EEG and EMG synchronization was maintained throughout the whole preprocessing. Data were further cleaned at group level by removing artifact dipole clusters. Source-level data were extracted and put through a time/frequency analysis processing step (violet box). Epoched EEG trials, locked to the gait cycle were selected based on gait events, grouped according to several regions of interest (ROIs), warped and averaged across subjects. Connectivity analysis was finally performed on joint aligned EEG/EMG data (yellow box).

