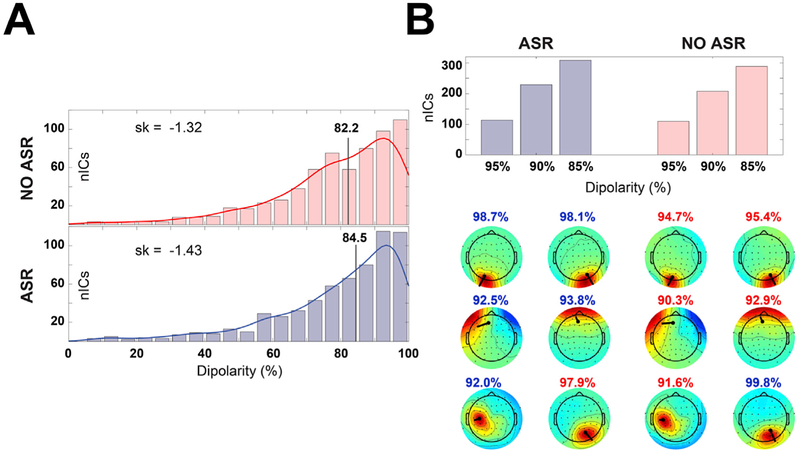
Fig. 3. ASR effect on ICA decomposition.
(A) Distribution of IC dipolarity without (top panel) and with (bottom panel) ASR preprocessing. The vertical line represents the median of the distribution, the skewness is reported on the left. (B) Number of quasi dipolar (dipolarity = 95%) and dipolar (dipolarity = 85%, 90%) ICs extracted with and without ASR preprocessing (top panel). The bottom panel shows a comparison of select IC scalp maps extracted with (left) and without (right) ASR from a representative participant (muscle artifacts – first row; ocular artifacts – second row; brain ICs – third row). IC dipolarity is represented in blue/red whether is higher/lower than the corresponding ASR or NO-ASR value.

