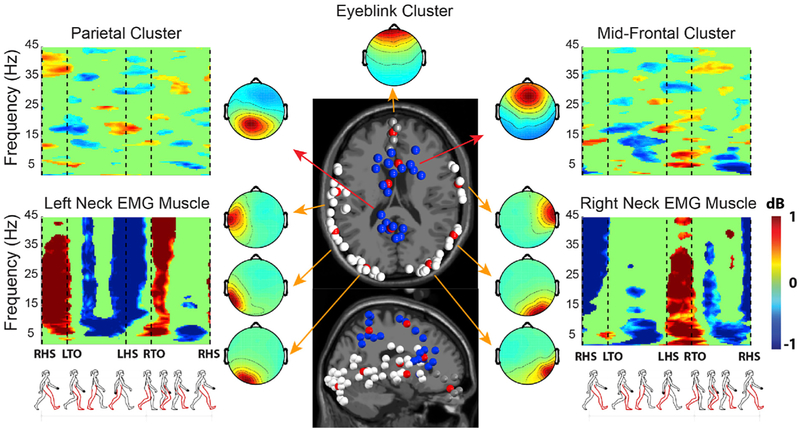
Fig. 5. Artifact and brain IC clusters.
Cluster-mean time/frequency power ratios (in dB) relative to the mean gait cycle spectrum, cluster-mean dipole locations (red balls) and cluster-mean scalp maps for several independent component (IC) clusters (neck muscles, ocular, mid-frontal and superior parietal). Grand-average time-frequency amplitude ratio to the mean gait cycle spectrum plots (ERSP), are masked for significance (p < 0.05); non-significant deviations are shown in green. Note the gait-appropriate EMG patterns (left neck muscles active during beginning and end of the left leg swing phase, right neck muscles during the right leg swing phase). Muscle artifacts show the typical widespread activity localized over many inferior scalp areas. This summary representation allows to correctly identifying artifact clusters and group together functionally-similar IC processes on the basis of multiple measures in the time and frequency domains, thus decreasing the chance of mistaking a non-brain artifact IC for a brain IC.

